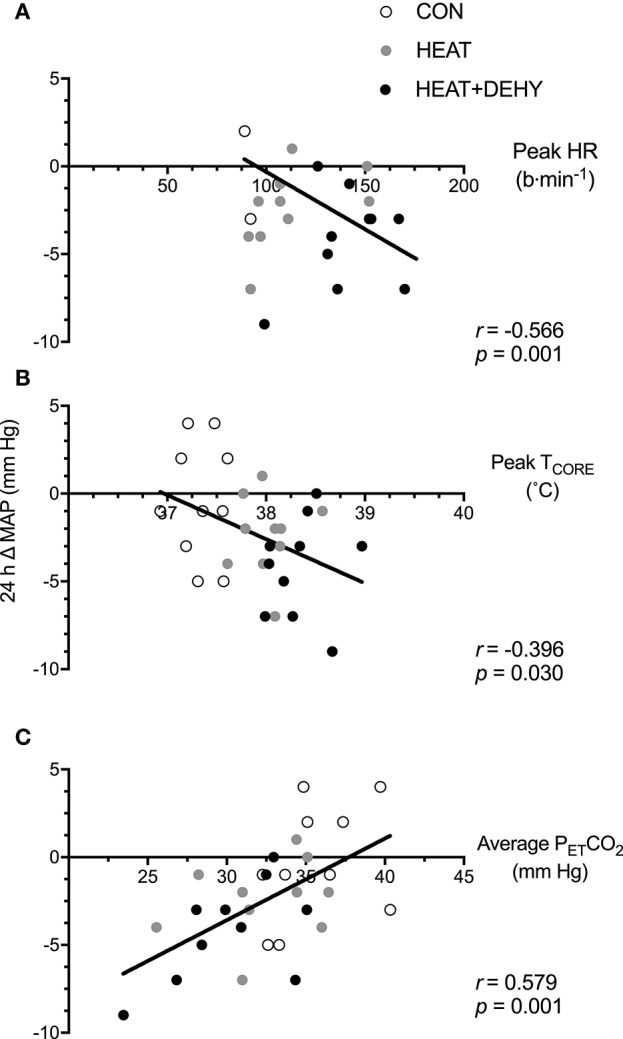
Figure 4.

The relation between different forms of stress-induced strain and the post-exercise hypotensive (PEH) response at 24 h. Illustrated are the contributions of the cardiovascular strain (A; peak HR in exercise), thermoregulatory strain (B; peak TCORE in exercise), and an indicator of respiratory strain (C; average end-tidal carbon dioxide (PETCO2) in exercise) to the 24-h change in MAP.
