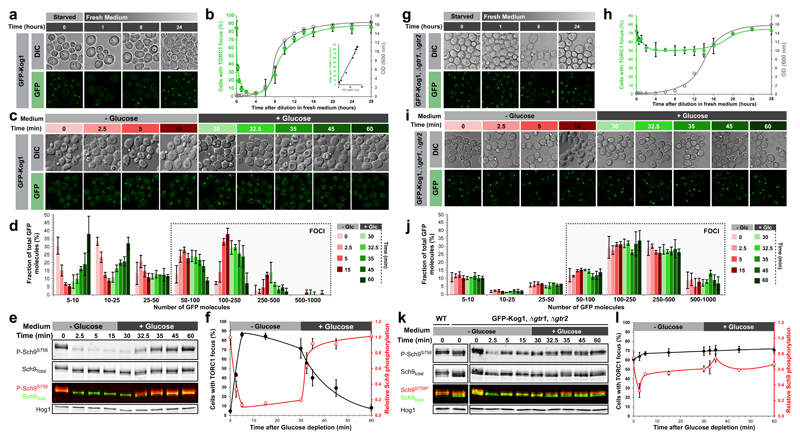
Figure 1. Glucose signals mediate TORC1 focus formation and activity in WT but not Δgtr1 Δgtr2 cells.
a/g, Confocal images of TORC1 (GFP-Kog1) in WT (a) and Δgtr1 Δgtr2 cells (g) following dilution of saturated cultures into fresh complete medium. b/h, Quantifications from a/g and a linear regression plot between the percentage of cells containing a focus and the optical density of the culture. c/i, Confocal images of TORC1 in WT (c) and Δgtr1 Δgtr2 (i) cells following glucose depletion and subsequent re-addition. d/j, Distribution of TORC1 focus sizes (number of GFP-Kog1 molecules) during glucose starvation / repletion from c/i. e/k, Western blot analysis of TORC1 activity (Sch9 Ser-758 phosphorylation) at the time points monitored in (c/i). Hog1 is a loading control. f/l, TORC1 activity is anti-correlated with focus formation in WT (f) but not Δgtr1 Δgtr2 (l) cells. Activity values are normalised to initial activity before glucose depletion. Data are mean ± s.d. and represent at least three independent biological experiments with at least 100 cells measured per experiment.

