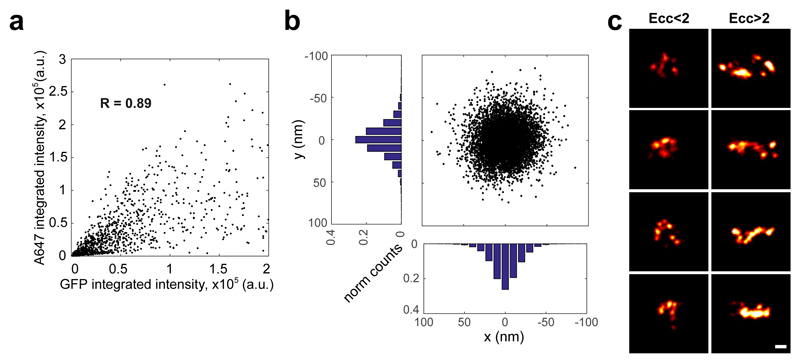
Extended data Figure 6. STORM supplementary data.
a, Correlation plot between A647 and GFP integrated intensities, measured for A647-conjugated anti-GFP nanobody-labelled TORC1 foci segmented from cytosolic signal. b, Graphical representation of A647 localisation precision along x and y axes, derived from A647-conjugated anti-GFP nanobody calibration. c, Gallery of reconstructed clusters classified according to their eccentricity (Ecc < 2 and Ecc > 2). Data corresponds to TORC1 foci imaged in wild-type cells expressing GFP-Kog1 grown into stationary phase. Scale bar 100 nm.

