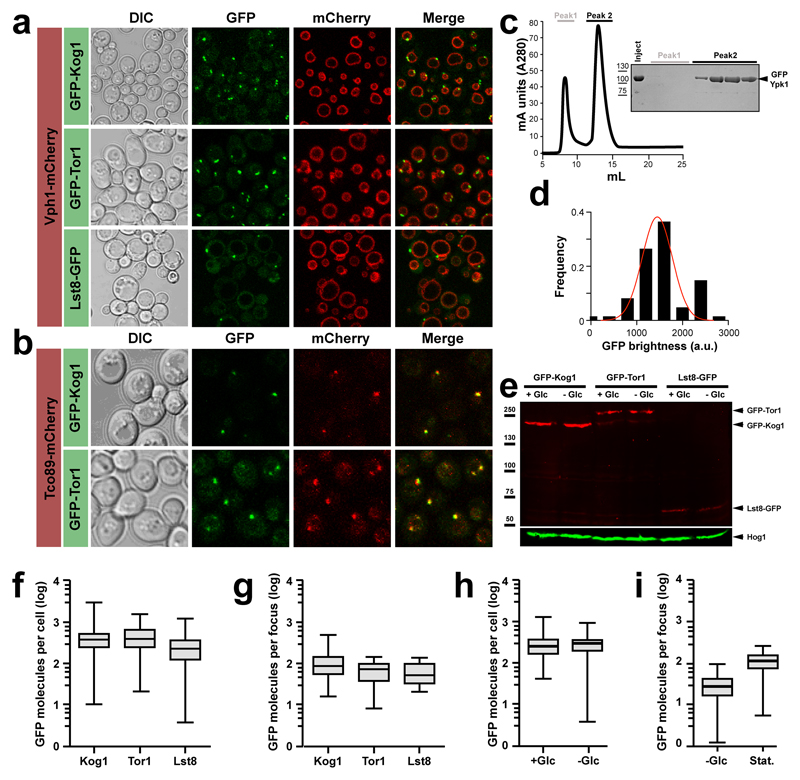
Extended data Figure 1. Stoichiometric colocalization of TORC1 subunits to a vacuole-associated focus.
a, and b, Differential interference contrast (DIC) microscopy and confocal images of yeast cells exiting exponential growth. Cells express GFP- and/or mCherry-tagged TORC1 subunits as indicated. Vph1-mCherry marks the membrane of the vacuole. We note, however, that the Lst8-GFP and Tco89-mCherry strains presented major growth phenotypes, which for Lst8 were so severe that we were unable to generate the strains necessary to assess its presumptive colocalization with other TORC1 components. c, Purification of GFP-Ypk1 used for GFP calibrations, quantifications and localisations. Left panel, Gel filtration plot showing void volume and GFP-Ypk1 monomer peaks. Right panel, Coommassie stained gel of purified fractions obtained by gel filtration. d, Distribution of single GFP brightness values calculated from GFP calibration using epi-fluorescence images of GFP-Ypk1. e, Anti-GFP western blot analysis of the GFP tagged TORC1 subunits expressed in the presence (+Glc) or absence (-Glc) of glucose. Hog1 is used as loading control. f, g, Boxplots of the number of GFP molecules per cell (f) and per focus (g) for the indicated GFP-tagged TORC1 subunits. Error bars represent s.d. for values obtained on at least 100 cells. h, Boxplot quantifying the number of GFP molecules per WT cell expressing GFP-Kog1 in the presence (+Glc) or absence (-Glc) of glucose. i, Boxplot quantifying the number of GFP molecules per focus in WT cells expressing GFP-Kog1 starved for glucose (-Glc) or grown into stationary phase (Stat.). f-i, Error bars represent s.d. for values obtained with ≥100 cells.

