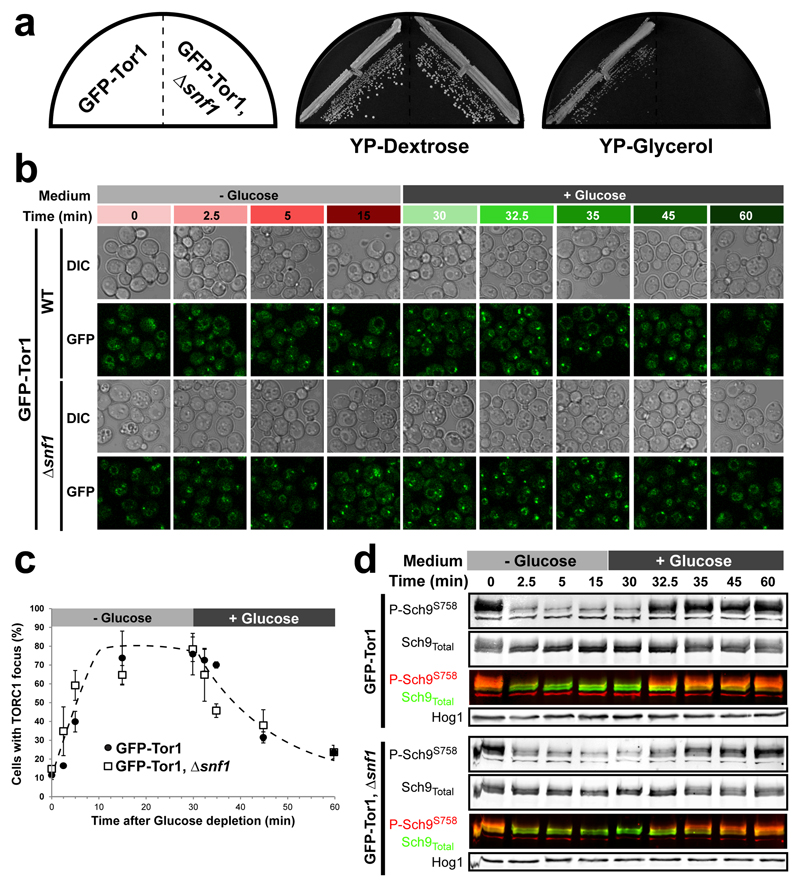
Extended data Figure 3. Snf1 does not contribute significantly to TORC1 focus dynamics.
a, Growth phenotypes on YP-Dextrose or YP-Glycerol plates of WT and Δsnf1 cells expressing GFP-Tor1. Δsnf1 cells show a characteristic defect in using glycerol as a carbon source. b, Representative confocal images of TORC1 focus formation in WT and Δsnf1 cells following glucose depletion (-Glucose, 0 min) and subsequent re-addition (+Glucose, 30 min). c, Percentage of cells displaying a TORC1 focus as measured from (b). Data are mean ± s.d. and represent three independent experiments. d, Western blot assessing the extent of Sch9 Ser-758 phosphorylation as a proxy of TORC1 activity, at the time points monitored in (b). Hog1 is used as loading control.

