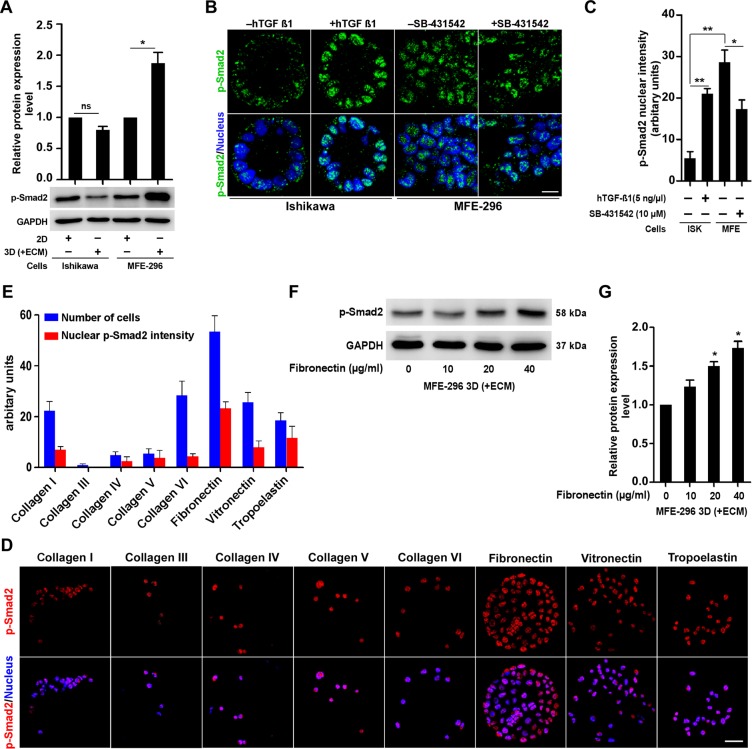
Figure 3. ECM protein, fibronectin modulates upregulation of TGF-β signalling via classical SMAD pathway.
A. Immunoblot for p-Smad2 protein, in 2D and 3D culture of Ishikawa and MFE-296 cells. Error bars are mean ± SD, n = 3; *P < 0.05. B. Confocal immunofluorescence analysis of p-Smad2 protein (green) in Ishikawa and MFE-296 cells after 72 hr post hTGF-β1/SB-431542 treatment. Nucleus stained with Hoechst (blue). Scale bar, 10 μm. C. Quantification of nuclear p-Smad2 fluorescence signal intensity in cells treated with hTGF-β1/SB-431542. Error bars are mean ± SD, n = 3; *P < 0.05, **P < 0.01. D. MFE-296 cells were cultured on MicroMatrix ECM array slide for 48 hr, stained for p-Smad2 (red) and counterstained with Hoechst (blue). Repeated twice with each having nine biological replicates. Scale bar, 50 μm. E. Quantification of nuclear p-Smad2 fluorescence intensity and number of cells grown on different ECM protein components. Data are shown as mean ± SD, n = 2. F. and G. Western blot and quantification for p-Smad2 in MFE-296 cells with increasing concentration of human fibroblast derived fibronectin are shown. Error bars represent mean ± SD, n = 3; *P < 0.05.

