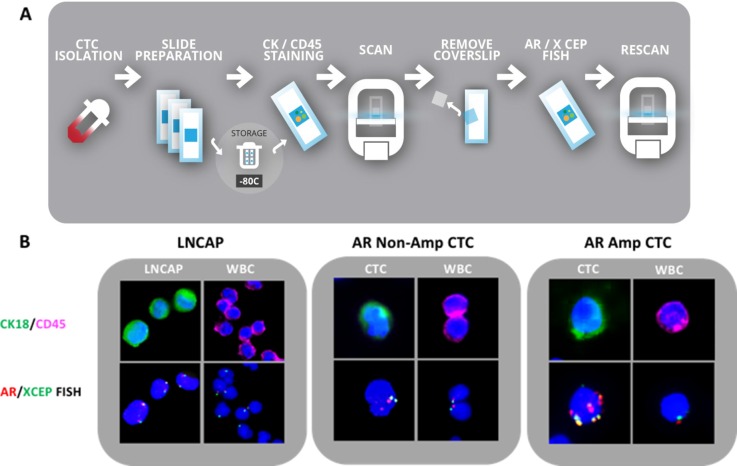
Figure 1. CTC capture and validation in LNCAP and mCRPC patients.
(A) Flowchart of CTC isolation, detection and molecular analysis workflow. (B) Left panel: LNCAP cells spiked into blood as a model for CTC capture and assay validation; Middle panel: Patient CTC without AR amplification; Right panel: Patient CTC with AR amplification. Upper panel immunofluorescence: Blue: dapi, Green: CK20, Pink: CD45. Lower panel: AR FISH analysis of cell identified in upper panel. Red: AR signal, green: X CEP control signal.

