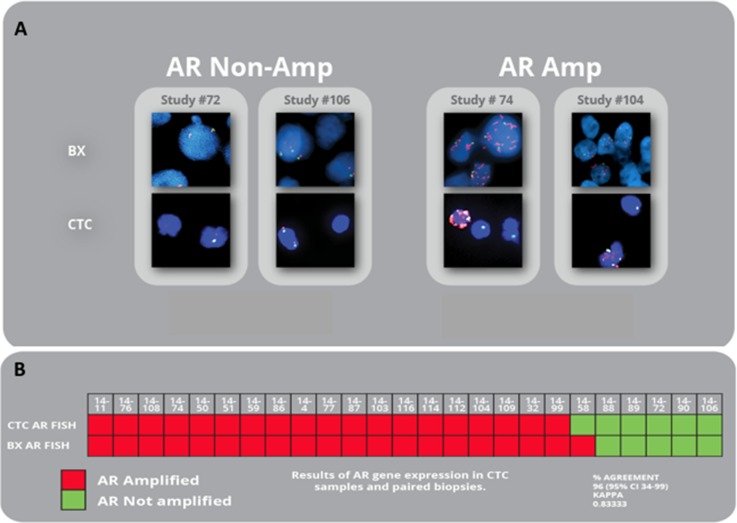
Figure 2. AR amplification in matched CTCs and biopsies from mCRPC patients.
(A) Representative images of paired CTC and biopsy patient samples without AR gene amplification (left) and paired patient samples expressing AR gene amplification (right). Red: AR signal; Green: Cep X control signal. (B) Results of AR gene expression in CTC samples and paired biopsies of all study subjects.

