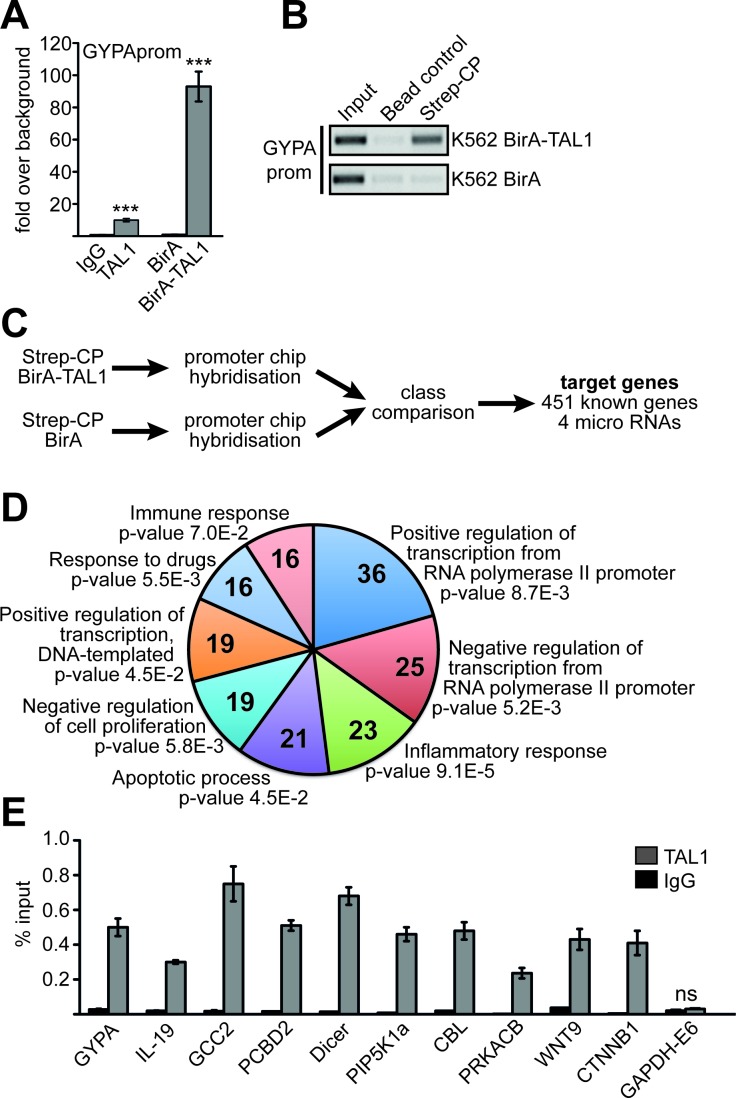
Figure 1. Identification of TAL1 target genes.
(A) Comparison of a chromatin immunoprecipitation (ChIP) using a TAL1 specific antibody and streptavidin/biotin chromatin precipitation (Strep-CP). ChIP-PCR is performed with primers specific for the promoter of the known TAL1 target GYPA. Values are given as fold over IgG background or as fold over background using a BirA-ligase only expressing K562 cell line (BirA) as control, respectively. Error bars represent the standard deviation from three independent evaluations. The P values were calculated using Student's t-test. ***P < .001. (B) Control Strep-CP from K562 cells harboring the BirA-ligase and BirA-TAL1 (upper part) compared to cells with BirA-ligase only (lower part). A precipitation with magnetic IgG beads was included as a negative control. ChIP-PCR was performed against GYPA promoter (GYPAprom). The PCR product was analysed on an agarose gel. The color inverted image of the gel is shown. (C) Flow chart showing the identification of TAL1 target genes by Strep-CP and ChIP analysis. (D) GO-term analysis using DAVID (DAVID Bioinformatics Resources 6.8) [33, 34] of the 451 potential TAL1 target genes. Shown are the eight GO-terms with the highest number of genes and the P values are given. Parameters for GO-term biological process (GO-BP direct) were default settings (with modified Fisher exact P value, EASE, set as 0.1). (E) Verification of TAL1 target genes found by Strep-CP using a standard ChIP with anti-TAL1 antibody. GYPA promoter was used as positive control and exon 6 of GAPDH (GAPDH-E6) as negative control. ChIP-PCR was performed with specific primer pairs against the given loci. Values are given as percent enrichment compared to the input. Error bars represent the standard deviation of two independent evaluations performed in duplicate. The P values for all verification ChIP experiments were at least P < .05 according to Student's t-test.

