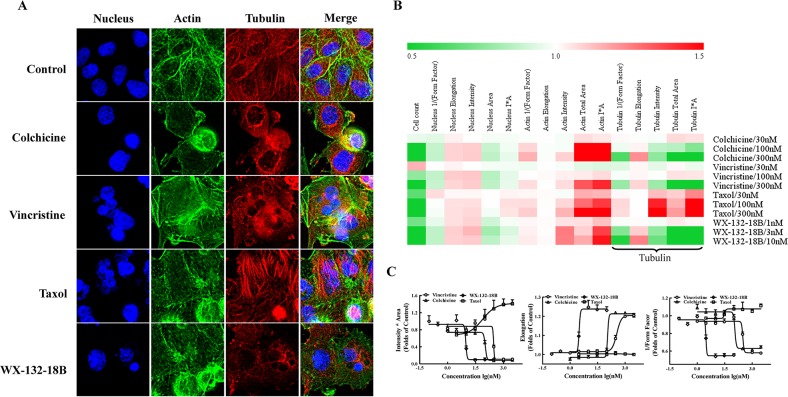
Figure 3. Impact of compound WX-132-18B on cellular skeleton and nucleus.
(A) Representative images of nucleus, actin, and tubulin of A549 cells after treatment with vehicle (0.1% dimethyl sulfoxide), colchicine (100 nM), vincristine (100 nM), taxol (100 nM), or WX-132-18B (3 nM) for 24 h. Tubulin was visualized with an anti-α-tubulin antibody (red), actin was visualized with Alexa Flour 488 phalloidin (green), and cell nucleus was visualized with Hoechst 33342 (blue). Images were acquired with an IN Cell Analyzer 1000 using a 20× objective lens. (B) Heat map analysis of tested compounds on cellular morphology multi-parameter assay in A549 cells by high content assay. (C) Concentration-effect curves of tested compounds on three different parameters of tubulin in A549 cells. Values are mean±SD, n=3.

