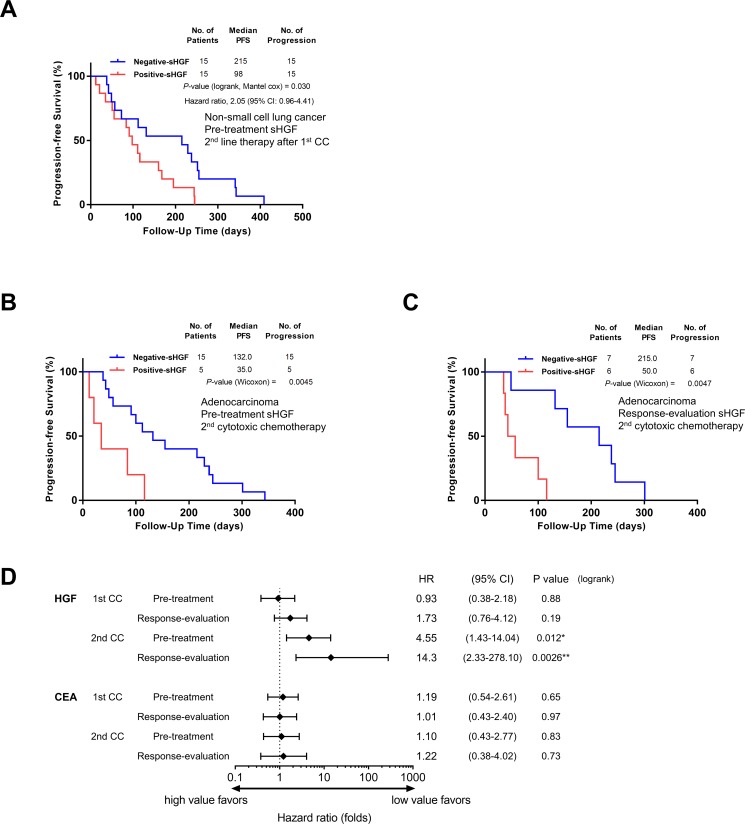
Figure 3. sHGF levels at a later time-phase predict progression-free survival in patients that received cytotoxic chemotherapy.
(A) A Kaplan-Meier curve for progression-free survival according to sHGF levels in patients that received second-line treatment after progression during first-line cytotoxic chemotherapy. The P-value was calculated using the Gehan-Breslow-Wilcoxon test. (B, C) A Kaplan-Meier curve for progression-free survival according to sHGF levels at pre-treatment (B) and at response-evaluation (C) in patients with lung adenocarcinoma receiving second cytotoxic chemotherapy. The P-value was calculated using the Gehan-Breslow-Wilcoxon test. (D) The hazard ratios (HR) for progression (black squares) and 95% CIs (horizontal lines). The HRs and P-values were calculated using the logrank test. The patients’ characteristics are presented in Supplementary Tables 4 and 5. HGF: hepatocyte growth factor; PFS: progression-free survival; 95% CI: 95 percent confidential interval; CC: cytotoxic chemotherapy; CEA: carcinoembryonic antigen.

