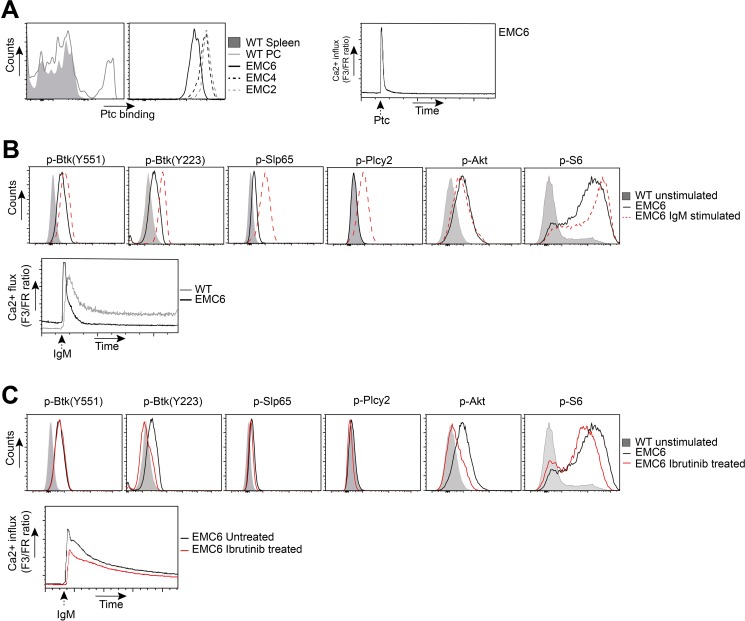
Figure 3. EMC cell lines recognize autoantigens and exhibit constitutive BCR signaling.
(A) Left: Flow cytometric analysis of gated wildtype (WT) CD19+ splenocytes and CD19+CD5+ peritoneal cavity (PC) cells, and EMC cell lines stained with phosphatidylcholine (Ptc) liposomes. Right: Ca2+-flux analysis of PtC-stimulated EMC6. (B) Top: PhosFlow analysis of indicated phosphoproteins on gated unstimulated B220+CD3− WT splenocytes and EMC6 cells, and a-IgM-stimulated (20 μg/ml) EMC6 cells. Bottom: Comparison of basal or a-IgM stimulated Ca2+ influx between B220+CD3− WT splenic B cells and EMC6. (C) Top: PhosFlow analysis of indicated phosphoproteins on gated unstimulated B220+CD3− WT splenocytes and EMC6 cells and 1 mM ibrutinib-treated EMC6 cells. Bottom: Comparison of Ca2+-influx between untreated or 1 mM ibrutinib-treated EMC6 cells. For all analyses EMC6 cells are shown as representative of the three cell lines.

