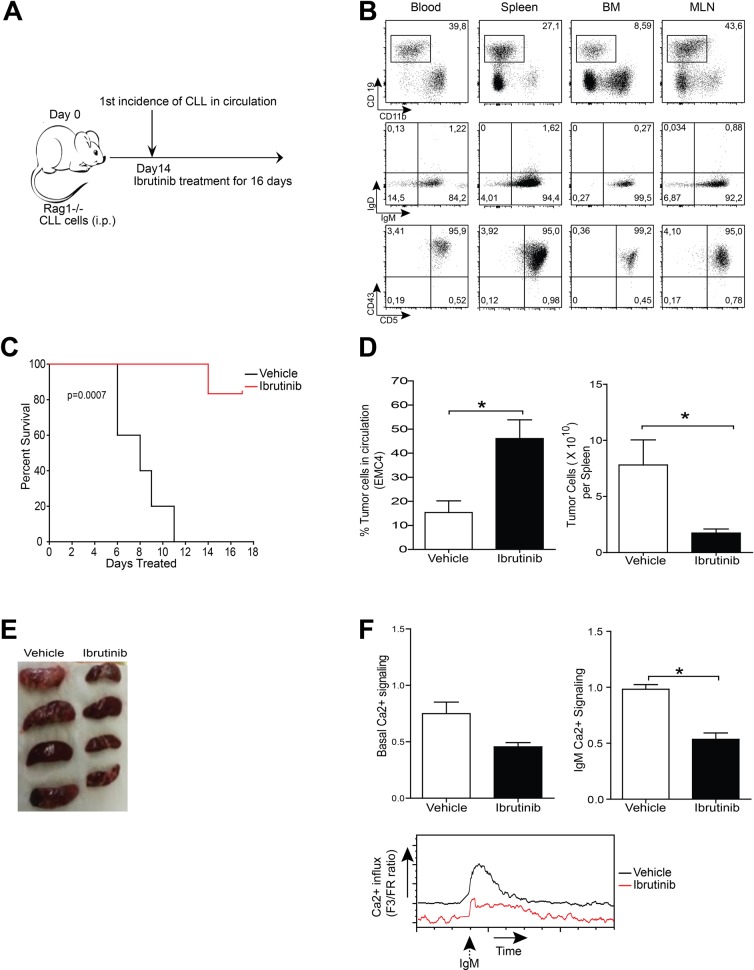
Figure 5. Leukemia induction following EMC cell engraftment as a tool to study therapeutics.
(A) Experimental timeline of EMC cell transfer. (B) Flow cytometric analysis of blood, spleen, bone marrow (BM) and mesenteric lymph node (MLN) of Rag1−/− mice after 4 weeks of engraftment of 5×10⁶ EMC4 cells. CD19+CD11b- cells were gated (left column) and analyzed for IgM/IgD and CD5/CD43 in the indicated tissues. Dot plots are representative of successful EMC cell engraftment. (C) Kaplan-Meier survival curve over 16 days of ibrutinib or vehicle treatment of EMC6- engrafted Rag1−/− mice (n = 8 mice/group). (D) Proportions of circulating leukemic cells (left) and absolute number of leukemic cells in spleen (right), 16 days after treatment of EMC4-engrafted mice with vehicle or ibrutinib (n = 4 mice/group). (E) Spleens from EMC4-engrafted mice treated for 16 days with vehicle or ibrutinib. (F) Comparison of basal and a-IgM-stimulated (20 μg/ml) Ca2+-influx ex vivo on splenic tumor cells from EMC4-engrafted mice treated for 16 days with vehicle or ibrutinib. Representative (n = 4) MFI kinetics plot of Ca2+ signaling (bottom) from each group.*P < 0.05 (n = 4 mice/group, Mann-Whitney U test).

