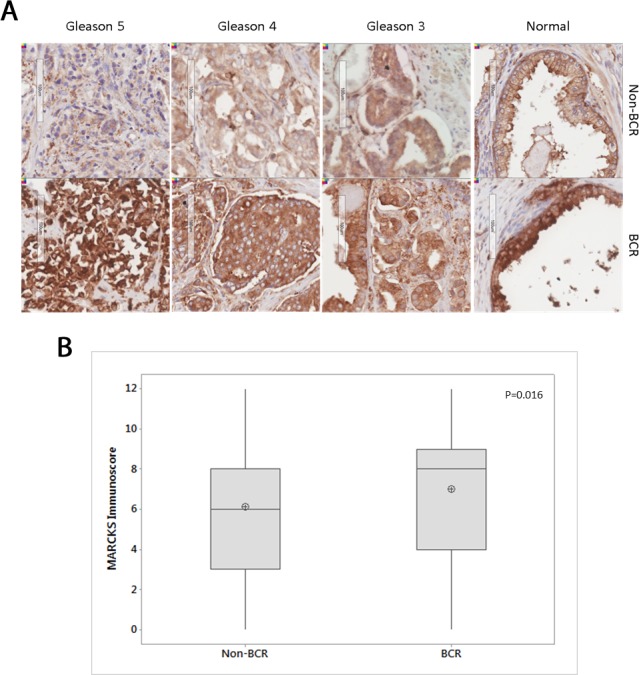
Figure 1. MARCKS staining in non-BCR and BCR cohorts.

(A) Representative IHC staining of MARCKS protein in different Gleason grades in non-BCR (n=36) and BCR (n=33) cohorts. (B) Boxplot of MARCKS staining immunoscore between non-BCR and BCR cohorts. Central line in boxplot represents median, circle represents mean. p=0.016 Pearson's Chi-square test.
