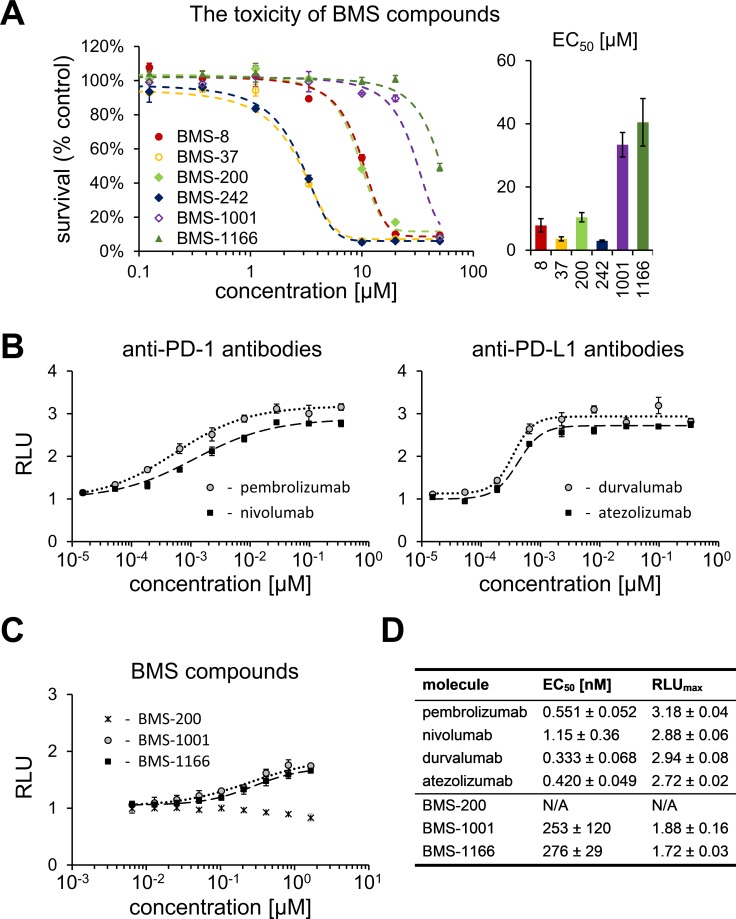
Figure 2. Cytotoxicity and activity of BMS compounds in PD-1/PD-L1 checkpoint assay.
(A) Cytotoxicity of BMS compounds against the PD-1 Effector Cells was tested using metabolic activity assay following the 48 h treatment of the cells with the indicated compounds. The presented EC50 values (right panel) are means ± SEM from the three independent experiments (left panel shows a representative result). (B, C) Activities of reference antibodies (B) and BMS compounds (C) in alleviating the effect of PD1/PD-L1 checkpoint on TCR-mediated T cell activation are expressed as the level of luciferase activity (for details see Materials and Methods). The graphs present relative luminescence normalized to the DMSO-treated controls and are representative of the three independent experiments. (D) The result of the fitting of Hill model to experimental data presented on panels B and C. EC50 values represent half maximal effective concentrations, and RLUmax values represent maximal relative luminescence values, and illustrate the potency of the listed molecules in restoring the activity of ECs in the assay.

