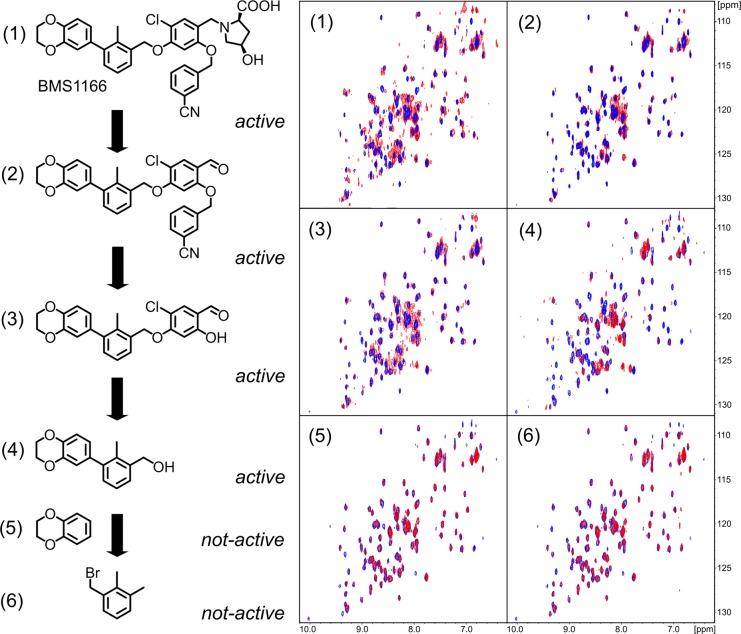
Figure 5. Decomposition of BMS-1166.
BMS-1166 (1) or its fragments (2-6) were tested for the interaction with PD-L1 (blue) using 1H-15N HMQC NMR method. The spectra determined in presence of compounds (1)-(4) display line-broadening (red), indicative of compound-induced formation of a higher molecular weight PD-L1 complex. Compounds (5) and (6) induced no changes in the spectra even at molar excess, indicating the lack of interaction.

