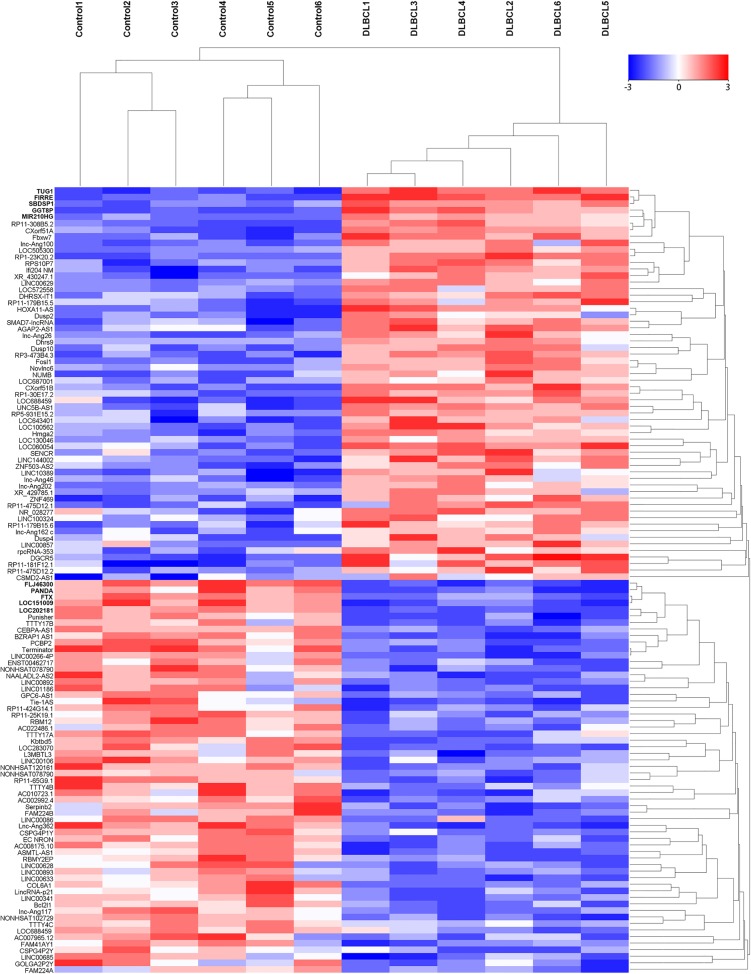
Figure 1. The heat map shows expression of the 120 lncRNAs most up- or down-regulated in DLBCL patients compared with healthy controls.
The top 60 lncRNAs up- and down-regulated in non-responding group are shown in the top and bottom halves, respectively. The heat map was generated with an R package using normalization across rows (serum samples).

