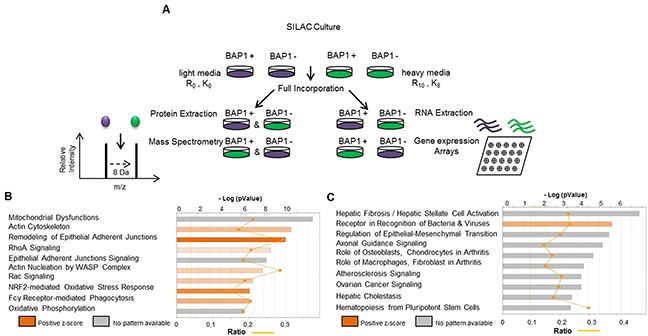
Figure 1. SILAC-based proteomics approach (SILAC/MS) reveals two major signatures associated with BAP1 expression.

(A) Description of the experiment procedure. NCI-H226 cell line expressing either an empty vector (EV) or wild-type BAP1 (BAP1wt) were cultured simultaneously in “light” (purple) and “heavy” (green) SILAC media. Gene expression arrays (Affymetrix®) and tandem mass spectrometry (MS/MS) were then performed in parallel in SILAC-treated cells material. After confirmation of >98% marked amino-acid incorporation by mass spectrometry analysis, equal amount of proteins were mixed and trypsin-digested. Peptides were quantified and identified by nano-LC-MS/MS. (B and C) Ingenuity Pathway Analysis (IPA) software was used to examine the biological processes enriched by differentially expressed proteins (B) and differentially expressed genes (C) after BAP1 re-expression.
