
Figure 3. BAP1 deubiquitinase activity is associated with decrease of mitochondrial active mass and reduced respiratory capacities.
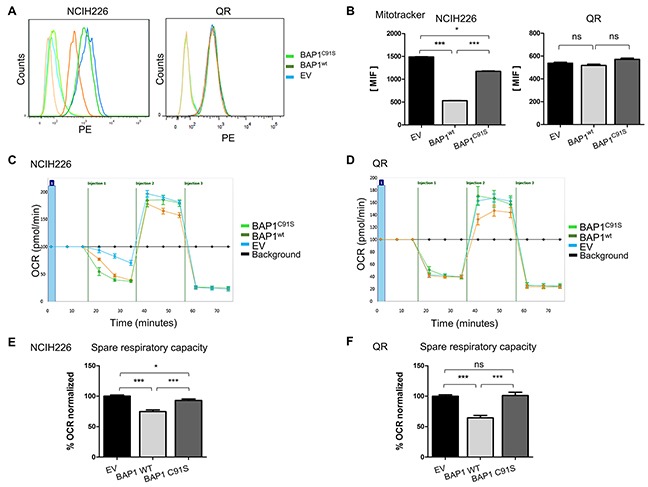
(A) Mitochondrial membrane potential was measured by FACS analysis using MitoTracker Red, reflecting mitochondrial activity and respective associated DMSO controls. (B) Bar graphs represent a quantification of mean intensity fluorescence (MIF). (C and D) The oxygen consumption rate (OCR) of cells is measured by the Seahorse XF-96 extracellular flux analyzer for NCI-H226 and QR (C and D, respectively) after the addition of three inhibitors: oligomycin (1μM or 1.5μM for NCI-H226 and QR cell lines respectively), FCCP (Carbonyl cyanide-4 (trifluoromethoxy) phenylhydrazone) (0.5 μM or 1μM for NCI-H226 and QR cell lines respectively), and a mix of rotenone + antimycin A (1 μM each), which are serially injected to measure ATP production, maximal respiration, and non-mitochondrial respiration, respectively.(i.e. injections). (E and F) Bar graphs are quantifications of respiratory capacity measurements for NCI-H226 and QR (C and D, respectively) (i.e. maximal respiration minus basal respiration). Data are mean ± SEM. *: P < 0.05, **: P < 0.01, ***: P < 0.001 versus Empty Vector (EV). Each experiment was repeated at least three times. EV, BAP1wt, BAP1C91S: NCI-H226 and QR transfected with empty, wild-type BAP1 and deubiquitinase dead BAP1 vectors, respectively.