
Figure 5. BAP1-related increased ROS level is involved in both morphological and metabolic changes in NCI-H226 cell line.
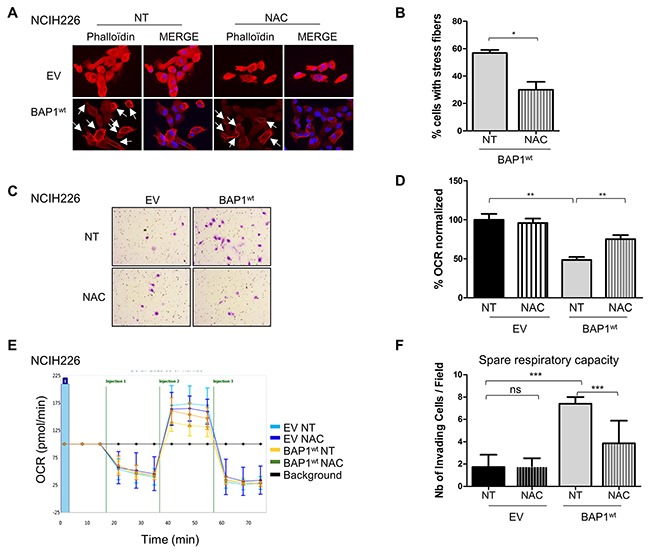
(A) Staining with DICT-phalloïdin (red) to observe F-actin fibers in cells treated with 500nM NAC (N-acetyl-cysteine) during 10 days versus non-treated cells (NT). Nuclei were counterstained with DAPI. Magnification x400. Cells presenting with stress fibers are indicated by white arrows. (B) Bar graph representing the percentage of cells with F-actin fibers counted in 7 images in two independent experiments. (C) Representative images of invasion in Boyden chambers taken 24h after seeding on cells treated with 500nM NAC during 10 days versus NT. (D) Bar graphs based on quantitative data from C. (E) The oxygen consumption rate (OCR) of cells measured by the Seahorse XF-96 extracellular flux analyzer after addition of 3 inhibitors at different time points (i.e. injections) on cells treated with 500nM NAC for 10 days versus non-treated cells (NT). (F) Bar graphs are quantifications of respiratory capacity measurements (i.e. maximal respiration minus basal respiration). Data are mean ± SEM. *P < 0.05 versus non treated empty vector (EV). Each experiment was repeated at least three times. EV, BAP1wt: NCI-H226 transfected with empty and wild-type BAP1 vectors, respectively.