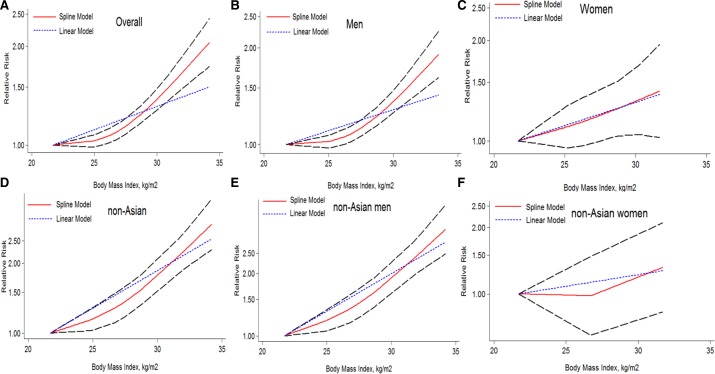
Figure 4. The dose-response analysis of BMI and liver cancer incidence risk.
The short dash line represents the linear relationship (per 1 kg/m2 increment). The solid line and the long dash line represent the estimated RR and its 95% CI respectively: (A) overall (1.04 (1.02–1.07) p = 0.000); (B) men (1.04(1.01–1.07) p = 0.000); (C) women (1.03 (1.01–1.06) p = 0.018); (D) non-Asian (1.07 (1.04–1.10) p = 0.000); (E) non-Asian men (1.08 (1.06–1.11) p = 0.000); (F) non-Asian women(1.02 (0.98–1.07) p = 0.301). RR, relative risk; CI, confidence interval; BMI: body mass index.

