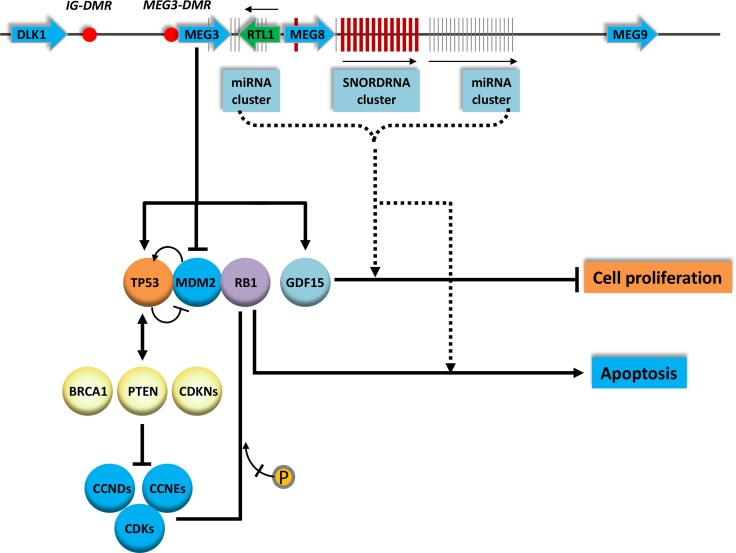
Figure 1. Genomic organization and schematic illustration on the involvement of MEG3 on cancer development.
The genes, mRNA and snoRNAs are indicated and the transcription orientations are indicated by arrows. The red dots represent differentially methylated regions. The schematic interactions of MEGs with key genes involved in cell proliferation and apoptosis are indicated. The arrows indicate activation. The doted lines are putative interactions.

