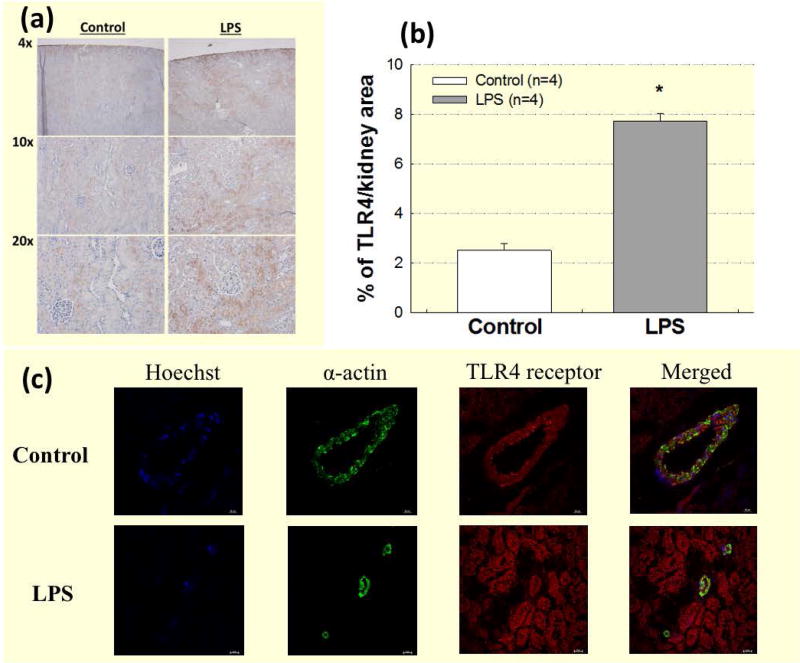
Figure 1. TLR4 is expressed in renal vascular smooth muscle cells and LPS treatment increases renal TLR4 expression.
TLR4 is expressed in renal vascular smooth muscle cells, and LPS treatment increases renal TLR4 expression. (a): DAB (TLR4) staining of kidneys from control (left panels) and LPS (1 mg kg−1; i.p.; right panels) treated groups. (b): Data are expressed as a percentage of total kidney area stained for TLR4 from control (white bars) and LPS treatment (grey bars). Each bar represents the mean ± SE. n=4 per group. (c): Immunofluorescence staining of TLR4 in OCT frozen whole kidney sections. Representative images show nuclear staining (blue; Hoechst), vascular smooth muscle α-actin (green), TLR4 (red), and co-localization of TLR4 and vascular smooth α-actin (yellow). Images were taken at 40x magnification. Bar = 20 μm. * P<0.05 vs. control TLR4 expression.

