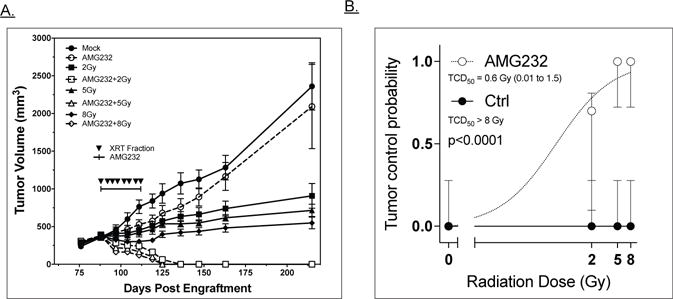
Figure 2. RT and AMG 232 combination therapy of ACC PDX.

A: Growth curves representing tumor volume of the 8 treatment groups as a function of days post engraftment. Filled symbols represent mock/RT only groups; open symbols are AMG 232/RT combination groups. RT fractions were delivered on days indicated by inverted triangles. AMG 232 or vehicle was delivered by oral gavage 1×/day over time period shown. B: TCD50 analysis of ACC PDX +/− AMG 232; data were fit to a log(treatment) vs. response curve using a least squares fit. TCD50 with RT alone was not reached and can only be stated as > 8Gy. In combination with AMG 232, the TDC50 was calculated at 0.6Gy with a 95% CI of 0.01 to 1.5 Gy. Error bars are 95% confidence intervals.
