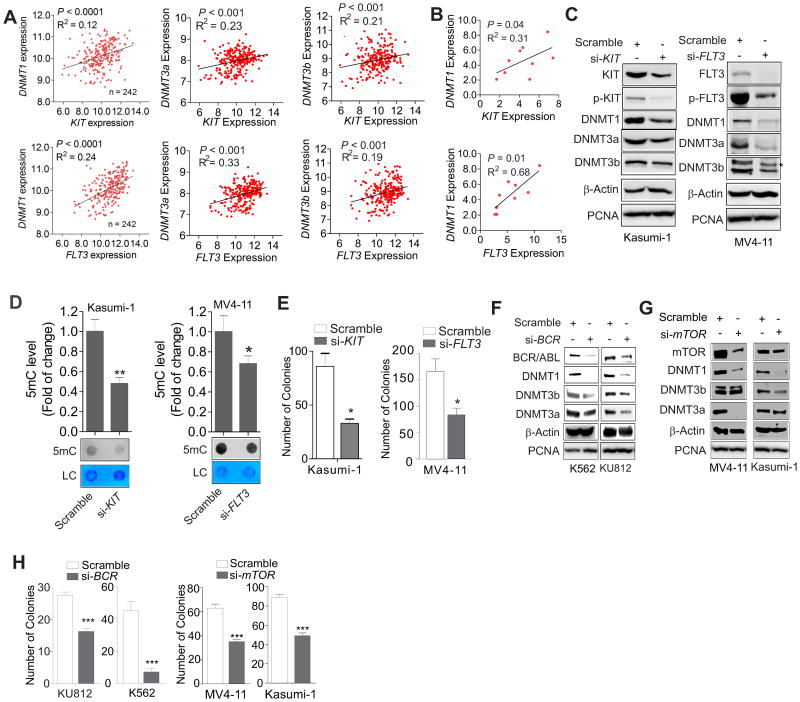
Figure 1.
KIT and FLT3 upregulate DNMT expression in AML cells. A and B, The analysis of the GEO dataset GSE12417 series, platform GPL570 and GPL96, AML, n = 242 (A) and qPCR results of 9 leukemia cell lines (B) showing the correlation between FLT3 or KIT and DNMT gene expression, which was assessed by Spearman correlation. C, Kasumi-1 or MV4-11 cells were transfected for 48 h with FLT3 or KIT siRNA (si-) or scrambled control and the expression of targeted genes was detected by Western blot analysis. D, MV4-11 or Kasumi-1 cells were transfected for 48 h with FLT3 or KIT siRNA, respectively, or scrambled control. The genomic DNA was subjected to dotblot analysis. Graphs are the quantification of dot intensity. E, Quantitative analysis for colony-forming assays of Kasumi-1 or MV4-11 cells transfected with FLT3 or KIT siRNA or scrambled control. F, K562 or KU812 cells were transfected for 48 h with BCR siRNA and the cell lysates were subjected to Western blot analysis. G, Kasumi-1 or MV4-11 cells were transfected for 48 h with mTOR siRNA or scrambled control. The cell lysates were subjected to Western blot analysis. H, Quantitative analysis for colony-forming assays of K562 and KU812 cells transfected with BCR siRNA (left) or MV4-11 and Kasumi-1 cells with mTOR siRNA (right). In C, D, F and G, data represent 3 independent experiments; In E and H, the assays were performed in triplicate; In D, E and H, data are shown as mean values ± S.D; *P < 0.05, **P < 0.01, ***P < 0.001.

