
Figure 3.
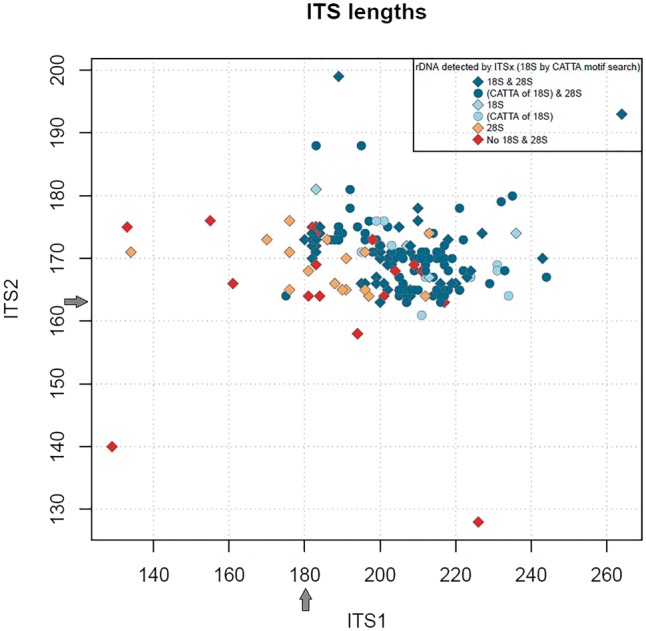
Graphical display of ITS1 length compared with ITS2 length from Trichoderma ITS RefSeq records. Grey arrows indicate the minimum lengths of ITS1 and ITS2 observed using ITSx annotation.
Official websites use .gov
A
.gov website belongs to an official
government organization in the United States.
Secure .gov websites use HTTPS
A lock (
) or https:// means you've safely
connected to the .gov website. Share sensitive
information only on official, secure websites.
Graphical display of ITS1 length compared with ITS2 length from Trichoderma ITS RefSeq records. Grey arrows indicate the minimum lengths of ITS1 and ITS2 observed using ITSx annotation.