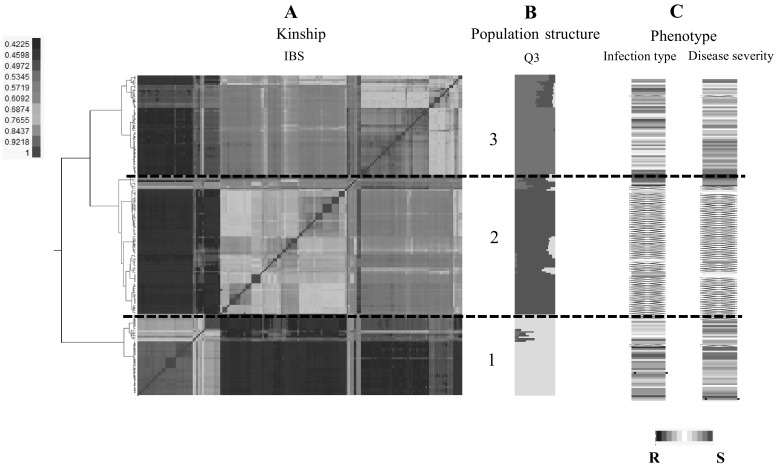
Fig. 1.

Population structure analysis of 176 cultivated emmer wheat accessions. a Heat map of kinship matrix on the basis of identical-by-state (IBS). b Population structure summary plot (k = 3) of membership coefficients using STRUCTURE v.2.3.4. From the bottom to the top, they are subpopulation 1, 2 and 3. The horizontal dashed lines separated the 176 accessions into three subpopulations according to structure membership coefficients. c Cell plot displayed phenotypic reactions to Puccinia striiformis f. sp. tritici (Pst) at the adult stages in STRUCTURE-based subpopulations. Red to white to blue lines indicate reactions to Pst changed from susceptibility to intermediate to resistance to stripe rust. Black lines indicate the accessions that displayed winter habit or had very late heading date that excluded from the GWAS analysis at the adult stages. The order of individuals in a–c were arranged according to their IBS-based genotypic distance
