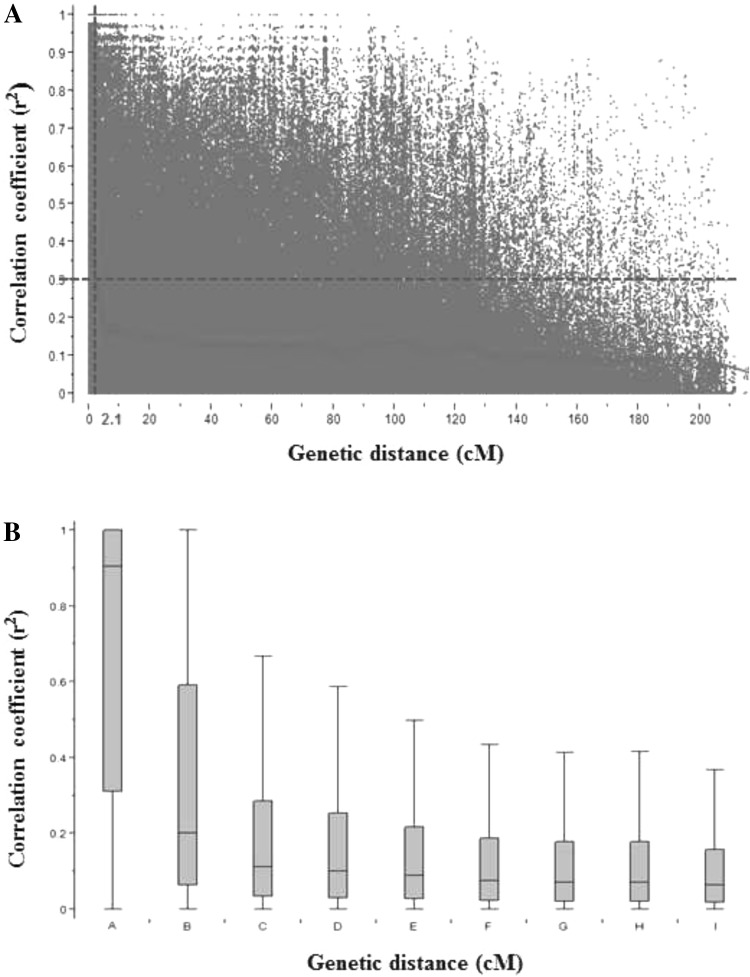
Fig. 2.
Genome-wide average linkage disequilibrium (LD) decay plot for 176 cultivated emmer wheat accessions based on 5106 single nucleotide polymorphism (SNP). a Plot of pairwise SNP LD r 2 value as a function of inter-marker genetic distances (cM). b Box-plot of LD r 2 between pairs of SNPs against incremental classes of genetic distances (cM). A, B, C, D, E, F, G, H and I mean inter-marker genetic distances at 0, 0.1–1, 1–5, 5–10, 10–20, 20–30, 30–40, 40–50 and >50 cM

