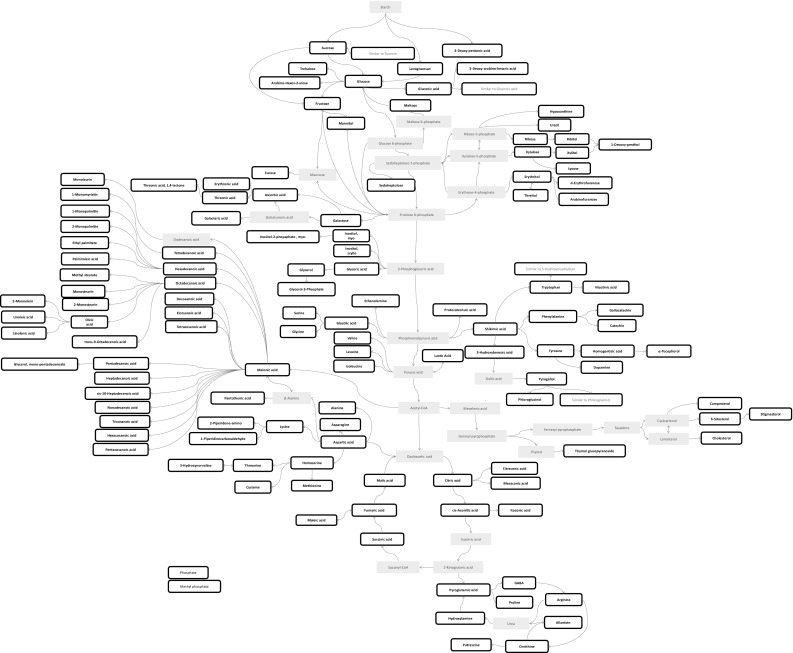
Fig. 1.

Map of measured primary metabolome of Dioscorea tubers. Visual representation of biochemical pathways of compound recorded in tuber extracts by the GC-MS profiling platform. Metabolites with preliminary identification are shown in green. Metabolites not detected by the platform are shown in red
