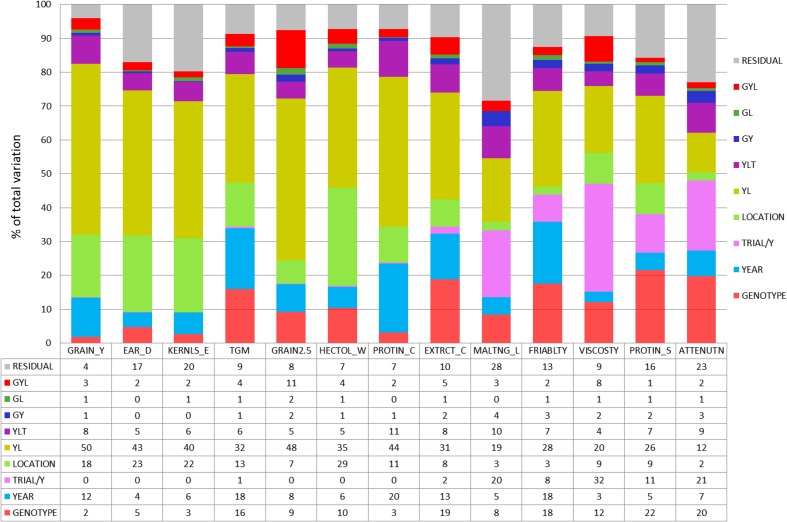
Fig. 4.
Sources of variation of traits from VCU trials after elimination of genetic and non-genetic trends as percentage of total variability [Eq. (1), using Eqs. (2) and (3)]. GRAIN_Y grain yield at 86% dry matter, PLANT_H, EAR_D single ear density, KERNLS_E number of kernels per ear, TGM thousand grain mass at 86% dry matter, GRAIN2.5 grain fraction with kernel size >2.5 mm, HECTOL_W hectoliter weight (test weight), PROTIN_C crude grain protein concentration (% of dry matter), EXTRCT_C extract content in dry matter (%), MALTNG_L malting loss, FRIABLTY friability, VISCOSTY viscosity, PROTIN_S protein solution degree (Kolbach value), ATTENUTN final attenuation degree

