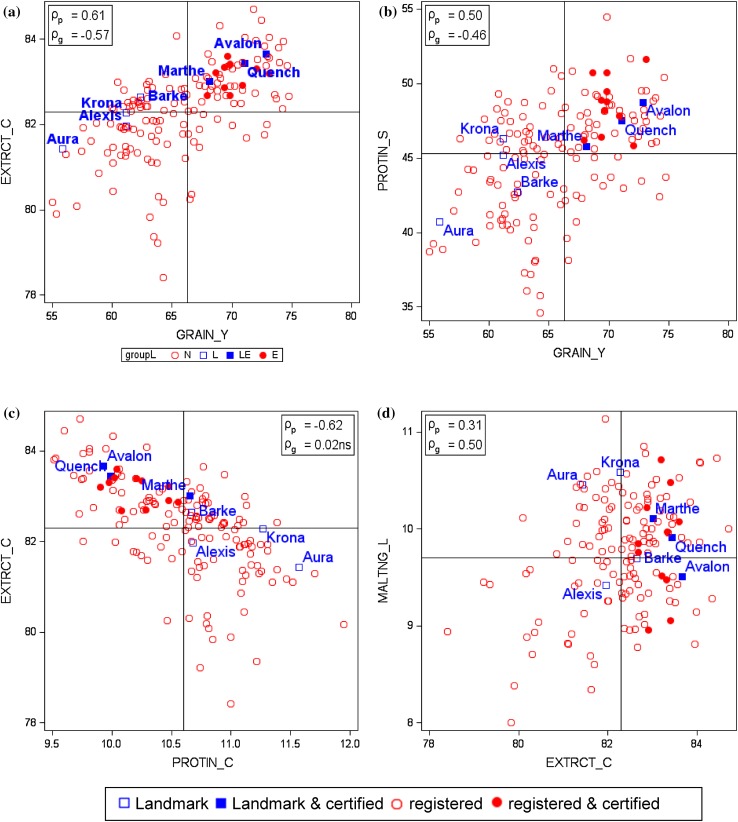
Fig. 6.
Phenotypic correlation of adjusted variety means [Eq. (1) keeping effects of genotype G i and years Y k fixed]. Reference lines are the averages of adjusted variety means as given in Table 3. ρ p: phenotypic correlation coefficient; ρ g: genetic correlation coefficient. ns not significant different from zero if p > 0.01. GRAIN_Y grain yield at 86% dry matter, PROTIN_C crude grain protein concentration (% of dry matter), EXTRCT_C extract content in dry matter (%), MALTNG_L malting loss, PROTIN_S protein solution degree (Kolbach value). Landmark dominating variety, certified certified by German Brewing Barley Association, registered registered for VCU

