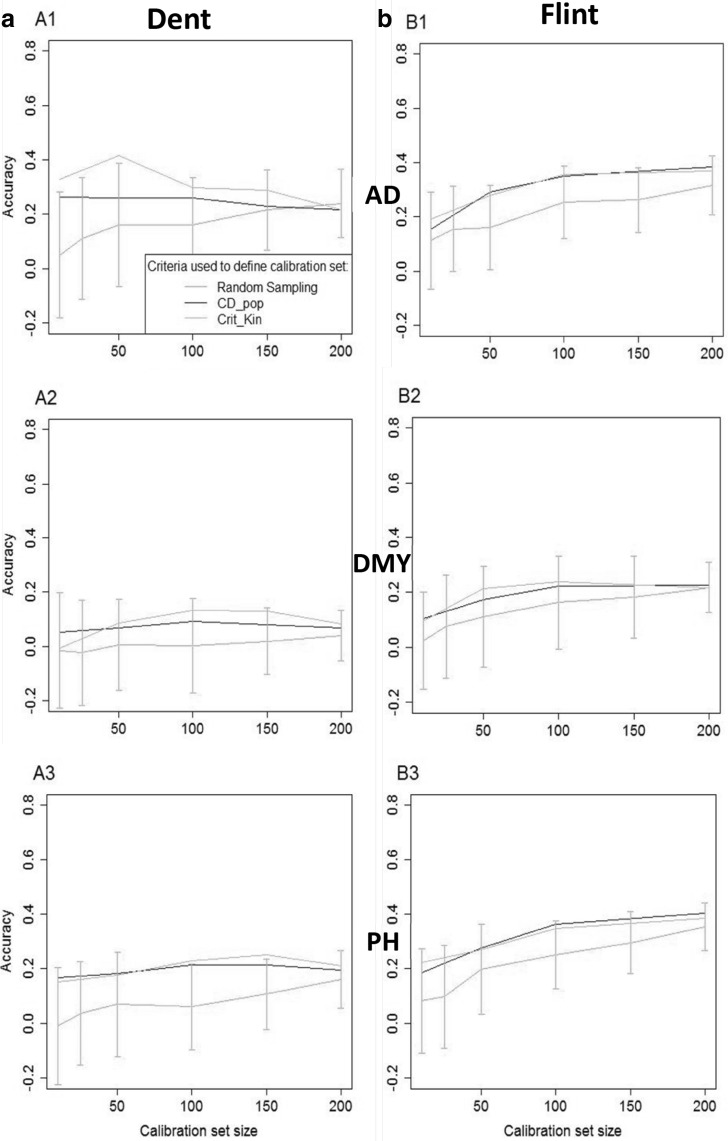
Fig. 4.
Observed accuracy (scenario OT2) obtained with the different calibration sets, for the different traits (A1 and B1: AD, A2 and B2: DMY, A3 and B3: PH) in the two NAM populations (a Dent, b Flint). The accuracies were averaged over the 10 families. In OT2 the calibration set is sampled from the highly diverse panels to predict one NAM family. The intervals indicated for the random samples correspond to an interval of two standard deviations (computed as the average of the standard deviations of the 10 families)

