
. 2016 Dec 10;18(9):1137–1156. doi: 10.1007/s10198-016-0859-1
© The Author(s) 2016
Open AccessThis article is distributed under the terms of the Creative Commons Attribution 4.0 International License (http://creativecommons.org/licenses/by/4.0/), which permits unrestricted use, distribution, and reproduction in any medium, provided you give appropriate credit to the original author(s) and the source, provide a link to the Creative Commons license, and indicate if changes were made.
Fig. 3.
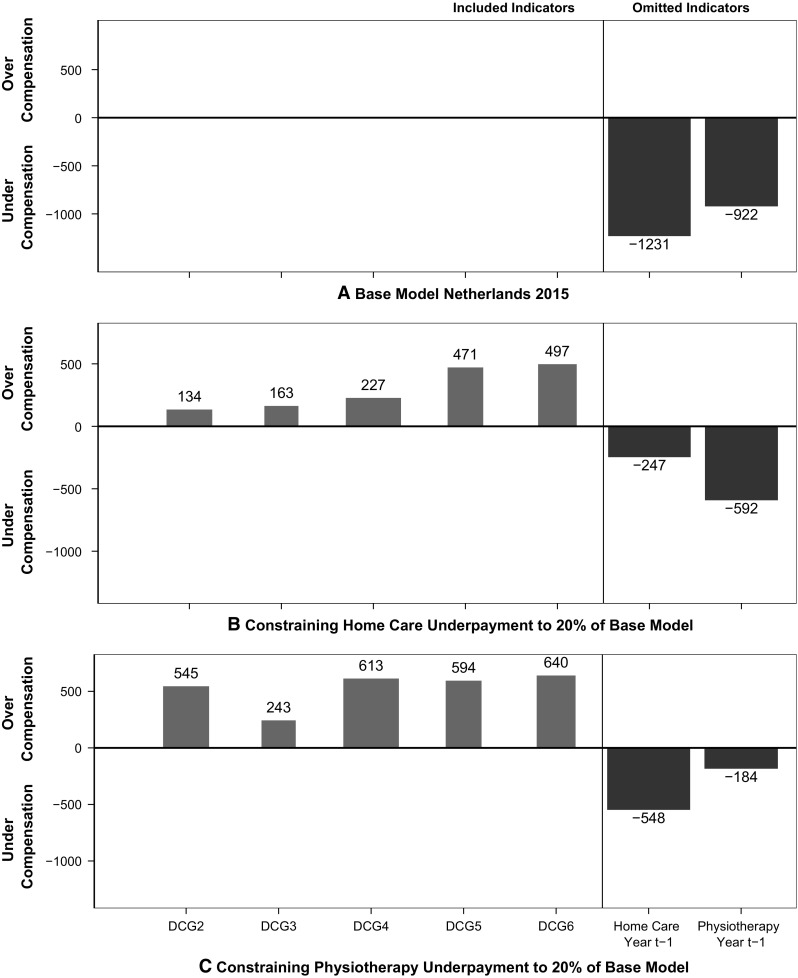
Over- and undercompensation in year t in three models (N = 16.5 m)