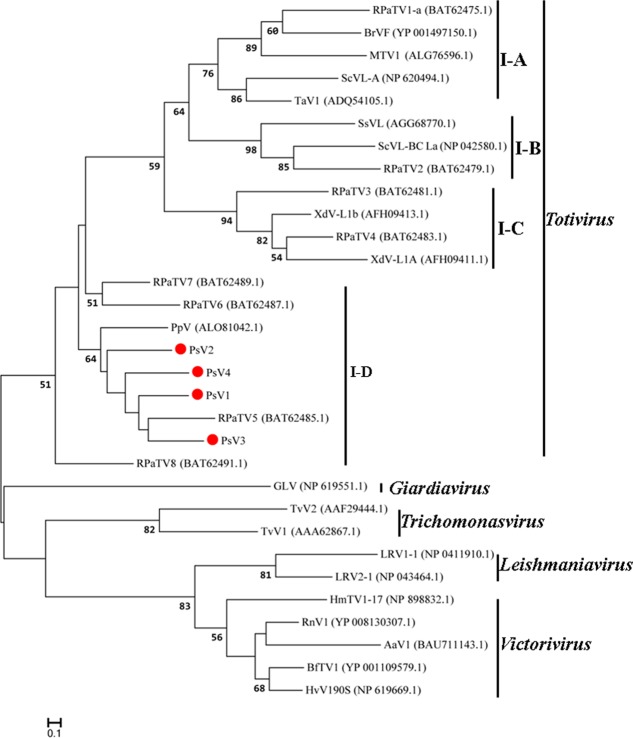
FIGURE 6.
Phylogenetic analysis based on the deduced amino acid sequences of putative CPs using the maximum likelihood (ML) method with 1,000 bootstrap replicates. The scale bar represents a genetic distance of 0.1 amino acid substitutions per site. Red circles indicate the novel mycoviruses PsVs in the present study.

