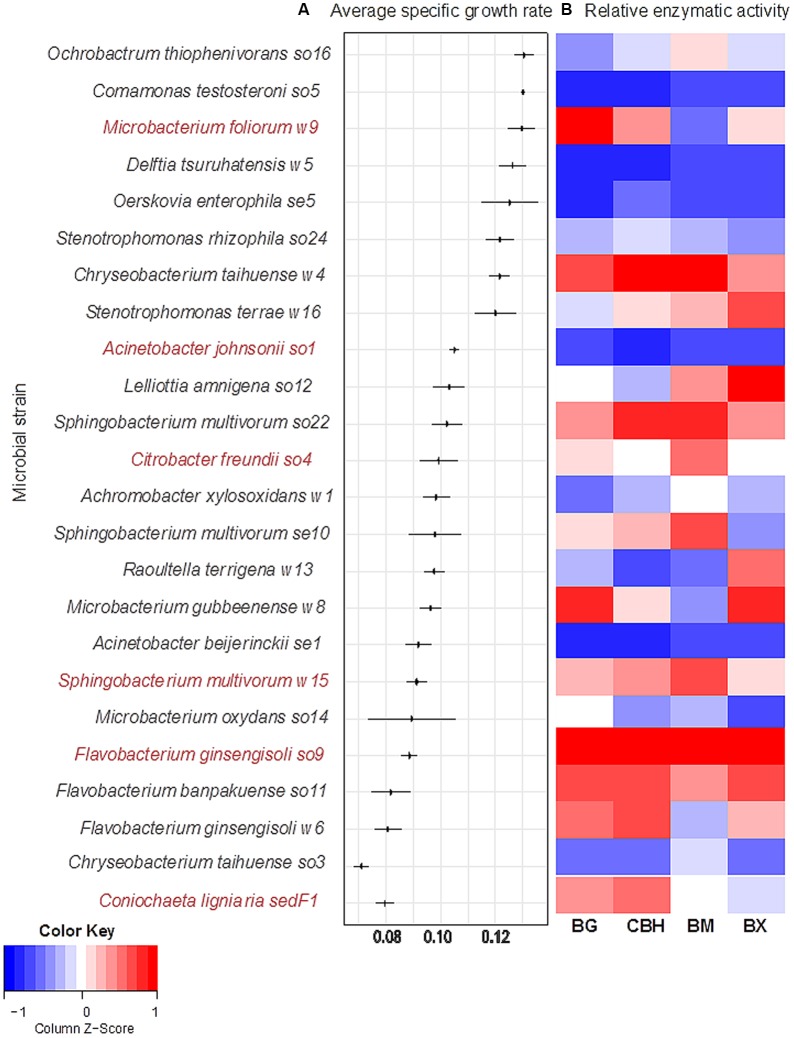
FIGURE 1.
Screening of growth and degradation capacity of selected microbial strains. Microbial strains were isolated from three different enriched consortia. (A) The left panel shows specific growth rates, μ (h-1), in decreasing order. Horizontal line represents standard deviation across triplicates. Selected strains are shown in red. (B) The right panel shows relative activity of four lignocellulolytic enzymes, BG, β-glucosidase; CBH, cellobiohydrolase; BM, β-mannosidase; and BX, β-xylosidase. The relative enzymatic activity is reported in nmol MUB released per h at 28°C, pH 6.8. Activity values are normalized by using log (x+1).

