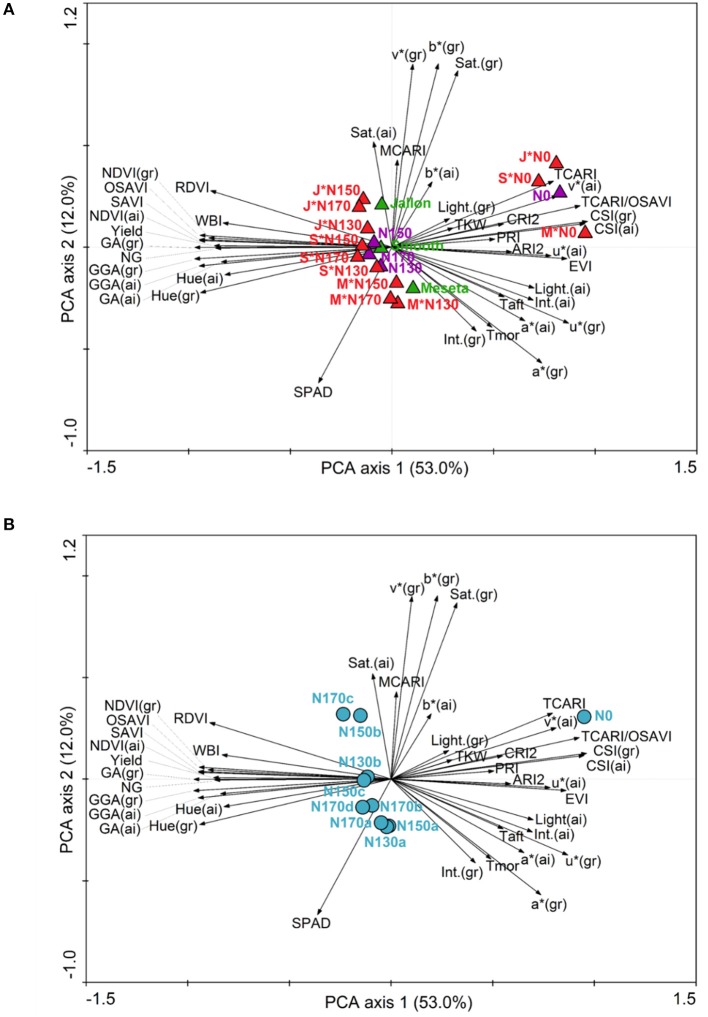
Figure 2.
Principal component analysis (PCA) of agronomical and physiological traits in three barley genotypes at different N levels. Arrows represent the variables and triangles the different genotypes (green), N levels (purple) and their interaction (red) in (A), and circles the different N levels and application dates in (B) according to Table 1. M, Meseta; J, Jallon; S, Smooth.

