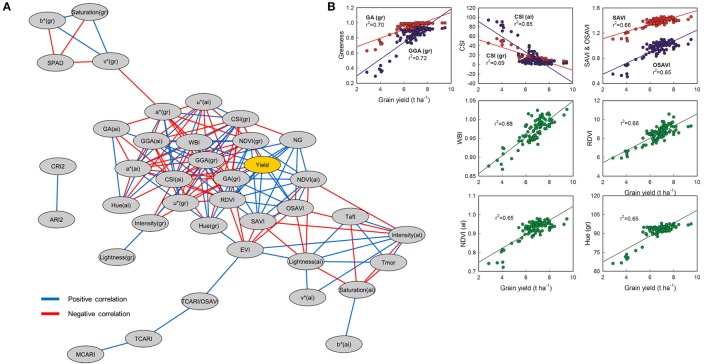
Figure 5.
(A) Correlation network for physiological traits in barley using three different genotypes and ten nitrogen treatments. Edge color represent positive correlations between traits in blue (Pearson's r > 0.6; P < 0.001) and negative correlations in red (Pearson's r < −0.6; P < 0.001). All the significant correlations between yield and other traits are shown in (B) (n = 90).

