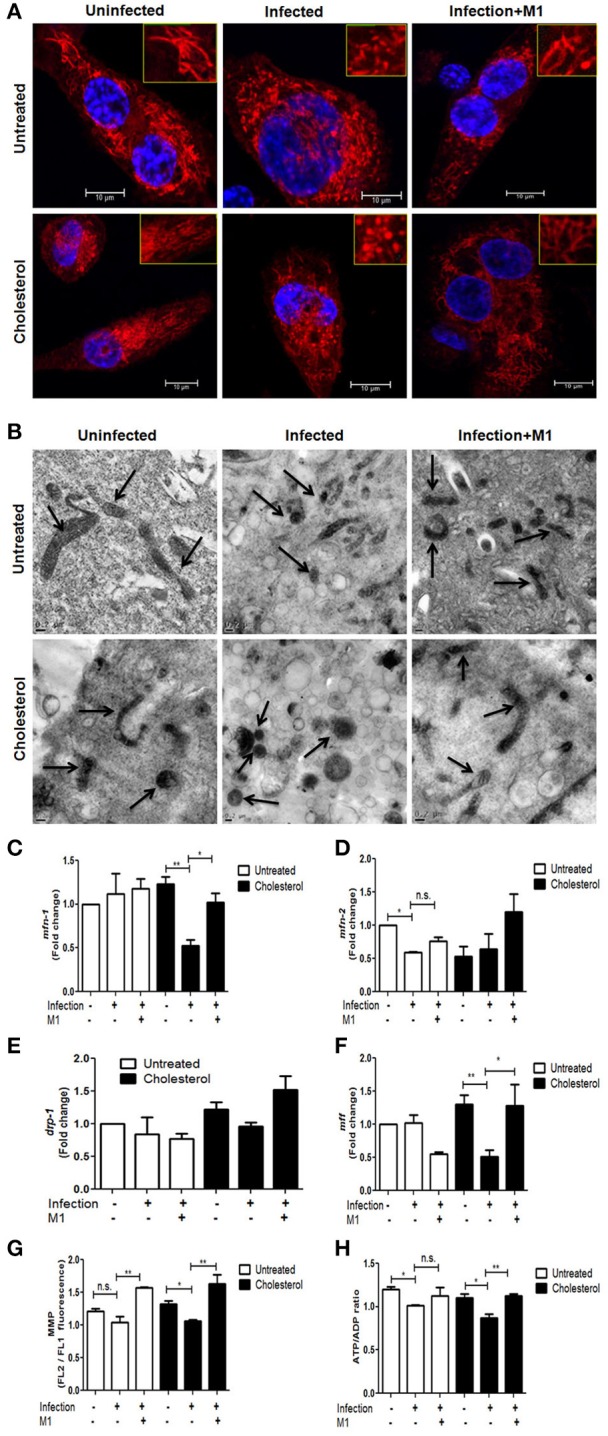
Figure 2.

Mycobacterial infection in cholesterol treated THP-1 cells altered mitochondrial structure and function, which was rescued by small-molecule M1. (A) Confocal microscopy showing distribution and shape of mitochondria stained by mito-tracker red (seen in red fluorescence) against a background of DAPI stained cells from each category. The images are representative of at the least five fields (scale bar 10 μm). The inset in each image is the zoomed image showing the gross mitochondrial shape. (B) Transmission electron micrographs depicting changes in the mitochondrial morphology from cells from each category. Arrows indicate representative mitochondria. The bar represents 0.2 μm scale. qRT-PCR-based changes in mRNA expression levels of mitochondrial fusion genes mfn-1 (C) and mfn-2 (D) as well as mitochondrial fusion genes drp-1 (E) and mff (F) in each category. Fold change in transcript levels were calculated as against untreated and uninfected THP-1 cells. The transcript levels were quantified by relative 2−ΔΔCt normalized against endogenous GAPDH. (G) Measurement of Mitochondrial Membrane Potential in each category as described in methods. The data is expressed as the ratio of FL2 to FL1. (H) Graphical representation of intracellular ATP/ADP ratios in each category using bioluminescence assay as described in methods. Each experiment was carried out at the least three times. Statistical analyses were performed as mentioned in methods. Error bars represent ± SD. *P ≤ 0.05; **P < 0.005.
