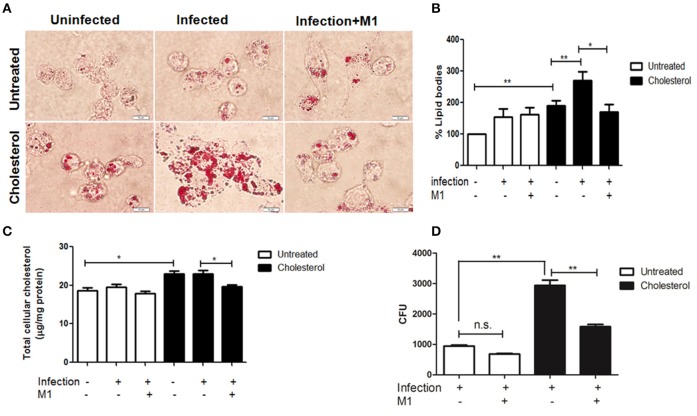
Figure 3.
Pharmacological intervention of M1 improves mycobacterial clearance by cholesterol treated THP-1 cells. (A) Representative bright field microscopy image showing the accumulation of lipid bodies by Oil Red O staining inside the untreated or cholesterol treated H37Rv infected cells upon 48 h post-infection, with or without M1 treatment. The white bar indicates 10 μm scale. Images were taken at 100 × magnification. (B) Bar graph representing the fold change in the accumulation of Oil Red O Stain as measured at Abs500 nm in different categories. Percentage changes were calculated with respect to the values of the untreated uninfected THP-1 cell. (C) Colorimetric assay quantifying total cellular cholesterol in each category. (D) Measurement of H37Rv clearance by CFU counts upon M1 treatment of untreated and cholesterol treated infected THP-1 as described. Each experiment was carried out at the least three times. Statistical analyses were performed as mentioned in methods. Error bars represent ± SD. *P ≤ 0.05; **P < 0.005.

