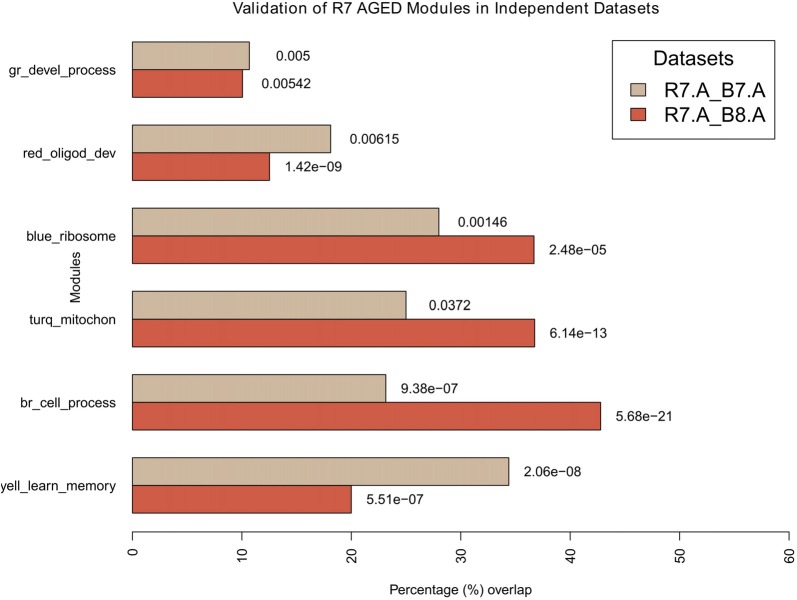
Figure 7.
Validation of aged modules in independent datasets. All modules in R7-A were compared for their significant overlaps in B8-A and B7-A. The percentage overlap is shown on the x-axis and the modules, along with their broad significant GO categories, are shown on the y-axis. Legends: gr, green; turq, turquoise; yell, yellow; br, brown.

