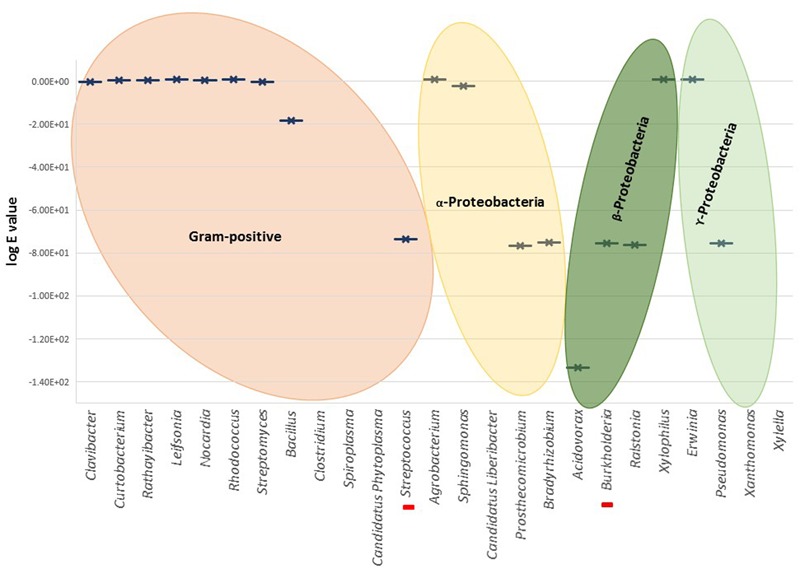
FIGURE 3.

Graphical representation of the highest Blastp scores (log e value) for different genera. Red bars in the X-axis represent unique cases inside the represented genus, i.e., Streptococcus pneumoniae and Burkholderia cepacia. There is no graphical representation for the genera in X-axis without significant similarities found by Blastp.
