Figure 4.
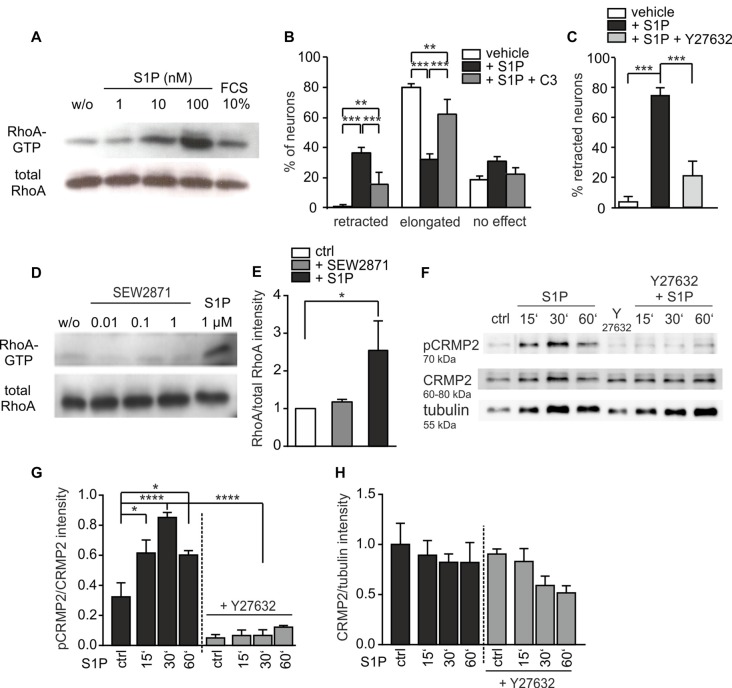
S1P induces retraction via Rho/ROCK activation and collapsin response-mediated protein-2 (CRMP2) phosphorylation. (A) RhoA activation was observed in a pull-down assay upon 10 min S1P treatment of adult DRG neurons cultured for 24 h. (B) C3-toxin, which inhibited Rho activation, reversed the S1P-dependent retraction decreasing the number of retracted neurons compared to S1P only -treated cultures (S1P vs. S1P + C3 retracted p = 0.0005, elongated p < 0.001, two sample t-test between percents; vehicle n = 77, S1P n = 108, S1P + C3 n = 106). Cultures were pre-treated overnight with C3-toxin and then treated with 1 μM S1P for 60 min in the presence of the toxin. (C) Treatment with Y27632 compound reversed the retraction effect of 1 μM S1P (p < 0.001, χ2-test; vehicle n = 27, S1P n = 76, S1P + Y27632 n = 134). Cultures were pre-treated for 1 h with Y27632 before S1P stimulation. (D) Different concentrations of SEW2871 after 10 min stimulation did not activate downstream RhoA in adult sensory neuronal cultures. (E) Quantification of RhoA levels obtained from cultures before and after 1 μM SEW2871 or 1 μM S1P treatment (ctrl vs. SEW2871, n.s. p = 0.5172; ctrl vs. S1P, *p = 0.019, Kruskal-Wallis test followed by Dunn’s post hoc test; n = 3). (F) Representative western blot for phospho-CRMP2 (pCRMP2 Thr-555) levels in wt DRG neuronal cultures before and after 15’, 30’ and 60’ S1P treatment (1 μM). (G) Quantification of pCRMP2 levels vs. CRMP2 obtained from treated and untreated cultures. Levels of total CRMP2 were similar in all samples. pCRMP2 levels increased significantly upon S1P stimulation, with a peak of CRMP2 phosphorylation/inactivity at 30 min (****p < 0.0001, one-way ANOVA followed by Tukey post hoc test; n = 3, ctrl vs. S1P 15’ p = 0.019, ctrl vs. S1P 30’ p < 0.0001, ctrl vs. S1P 60’ p = 0.027). These levels were significantly reduced, thus CRMP2 phosphorylation was reversed, upon Y27632 inhibitor (S1P 30’ vs. Y27632 + S1P 30’ p < 0.0001). (H) Total CRMP2 levels were similar in all samples and not significantly different compared to tubulin (p = 0.2478, one-way ANOVA; n = 3). *p < 0.05, **p < 0.01, ***p < 0.001, ****p < 0.0001.

