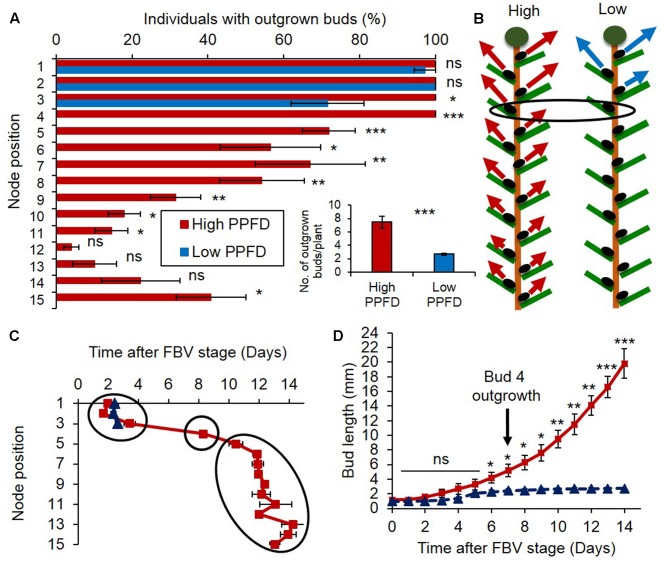
FIGURE 1.
Impact of PPFD on bud outgrowth pattern along rose primary axis. (A) Percentage of individuals with outgrown buds 14 days after FBV (floral bud visible) stage according to node position along the shoot. (A-inset) Total number of buds per plant that grew out 14 days after FBV. (B) Schematic representation of the bud outgrowth pattern of plants grown under high or low PPFD treatments: at each node position an arrow indicates that the bud grows out whereas an absence of arrow indicates bud inhibition, the longer the arrow, the higher the percentage of individuals with outgrown buds at this node position. (C) Date of bud outgrowth according to bud location. (D) Elongation of bud 4 along time under high or low PPFD treatment. On day 8, first leaf protrudes out bud scales, marking bud outgrowth. Buds are numbered basipetally along the stem. Each point represents the average of three repetitions, with 10 plants per repetition. Error bars represent the standard error of the mean (SE). ANOVA: ∗P < 0.05; ∗∗P < 0.01; ∗∗∗P < 0.001.

