
FIGURE 4.
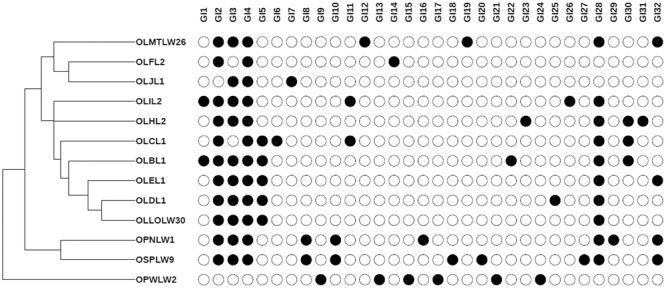
Genomic Islands profiles in Orius derived, Serratia-like facultative symbionts. Presence–absence map showing the distribution of representative GIs per genome (C). GI number corresponds to those described in Supplementary Table 7. Dendogram generated based on GI presence/absence per genome.