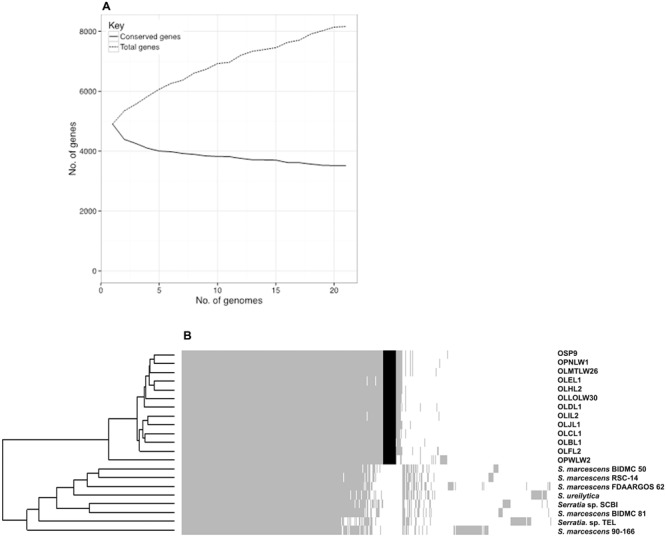
FIGURE 5.

Pangenome analysis of strains within the Serratia SCBI complex. Overview of the complete pangenome displays stabilising conserved gene content while total gene content continues to augment, suggestive of an open pangenome for the SCBI complex (A). The pangenome gene presence/absence metrics displayed as a heatmap highlights the diversity within the SCBI complex. Grey shading confirms gene presence, white space confirms gene absence, and black shading highlights all Orius-associated genes absent from all other members of the SCBI complex (B).
