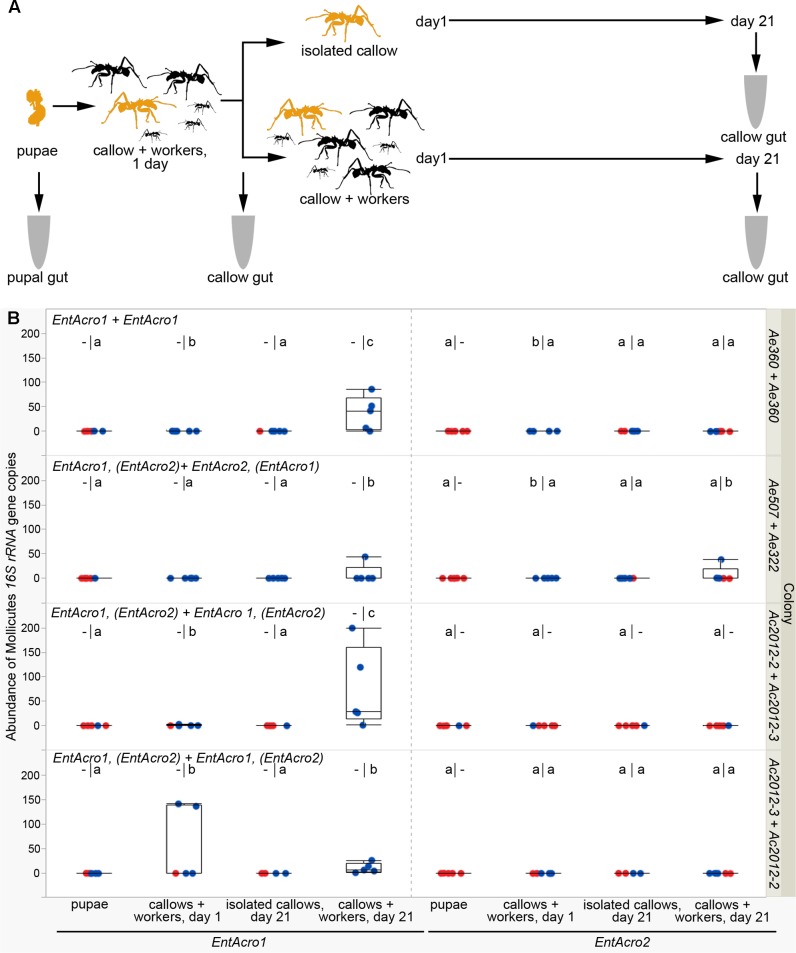
FIGURE 4.
Acquisition of Mollicutes bacteria by workers after hatching. (A) Schematic diagram of the experiment. Pupae and newly emerged workers are colored in yellow, while major and minor ants from the paired colony are shown in black. Guts of pupae and callows were sampled for analyses. (B) Density of Mollicutes expressed as 16S rRNA gene copies normalized per gut cell number. The first Mollicutes OTUs above each plots correspond to the known infections of the colony from which pupae were taken and the second (after the +) to the known infections of the nursing workers that interacted with callows emerging from these pupae (in brackets when Mollicutes were not present in all tested workers or were present in low abundances; for more information see Supplementary Table S8). Red dots correspond to bacterial scores of zero, while blue dots are scores above zero. The lower-case letters above each boxplot indicate significant differences between groups resulting from two different statistical tests. On the left side, different letters indicate significant differences (p < 0.05) in binomial (1/0 = presence/absence) tests (performed only in colonies where the “pupae” group had all zero scores and this group was omitted from further analysis). On the right side, different letters indicate significant differences (p < 0.05) in bacterial densities between groups in post hoc pairwise multiple comparisons. – indicates that a corresponding test was irrelevant or could not be performed.

