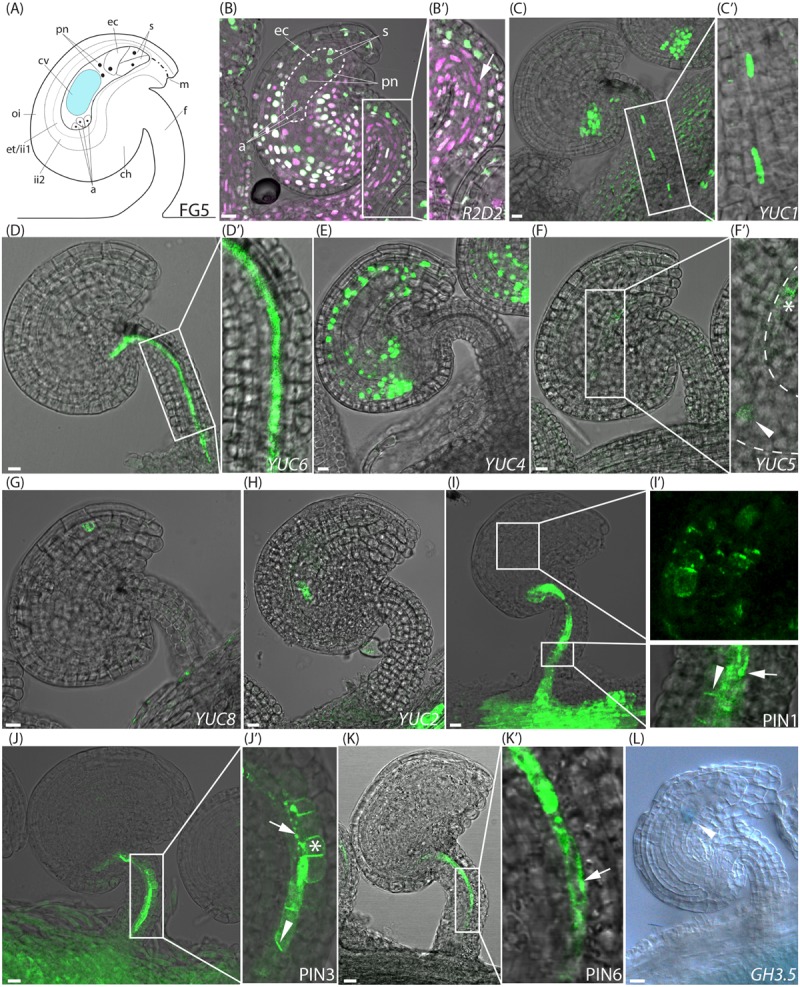
FIGURE 1.

Activity of auxin related reporters at the pre-anthesis stage of FG5. (A) Schematic overview of an ovule at stage FG5. a, antipodal cells; ch, chalazal domain; cv, central vacuole; ec, egg cell; et, endothelium; f, funiculus; ii, inner integuments; m, micropylar end; oi, outer integuments; pn, polar nuclei; s, synergid cells. (B–K) Merged confocal and transmitted light images, showing the expression of different fluorescent reporter constructs in ovules carrying an embryo sac at the seven cell, eight nuclei stage. (B′,C′,D′,F′,I′,J′,K′) show higher magnifications of the boxed areas in (B,C,D,F,I,J,K), respectively. (B,B′) R2D2 activity, dotted area indicates the female gametophyte with annotations as in (A), arrow indicates DII depletion in the central funicular cell files. (C) YUC1pro:n3xGFP expression in the chalazal domain of the ovule and in the third cell file of the funiculus, (D) YUC6pro:eGFP expression in the fifth cell file of the funiculus, (E) YUC4pro:3xGFP expression in the inner integuments, (F,F′) YUC5pro:eGFP expression in the micropylar end of the inner integuments (star) and in the female gametophyte (arrowhead), dashed line indicates female gametophyte, (G) YUC8pro:eGFP expression in the micropylar end of the inner integuments, (H) YUC2pro:eGFP expression in the female gametophyte, (I,I′) PIN1pro:PIN1-GFP expression around the female gametophyte and in the three most central cell files of the funiculus, arrowhead indicates basal PIN1 localization, arrow indicates internal PIN1 localization. (J,J′) PIN3pro:PIN3-GFP expression in the five most central cell files of the funiculus, arrowhead indicates basal PIN3 localization, arrow indicates internal PIN3 localization and star indicates apolar PIN3 localization. (K,K′) PIN6pro:PIN6-GFP expression in the fifth cell file of the funiculus, arrow indicates internal PIN6 localization. (L) DIC image of a GUS stained stage FG5 GH3.5pro:GUS ovule, arrowhead indicates GH3.5 expression in the female gametophyte. Bars = 10 μm. All images are representatives of at least 10 independent samples.
