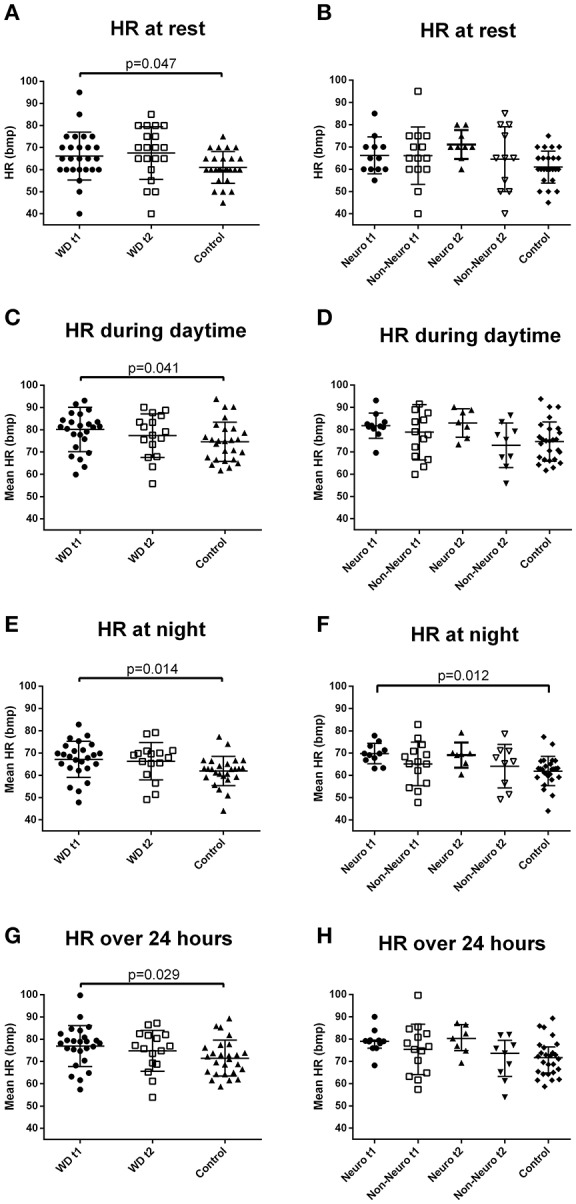
Figure 1.

Heart rate of the Wilson's disease patients and the controls under different conditions. (A) Baseline resting heart rate was higher in the Wilson's disease patients than the controls (independent t-test). (B) Resting heart rate of the two subgroups of Wilson's disease patients and the controls. (C) Daytime mean heart rate during the 24-h heart rate recording was higher in the Wilson's disease patients than the controls (independent t-test). (D) Daytime mean heart rate during the 24-hour heart rate recording of the two subgroups of Wilson's disease patients and the controls. (E) Night-time mean heart rate during the 24-h heart rate recording was higher in the Wilson's disease patients than the controls (independent t-test). (F) Night-time mean heart rate during the 24-h heart rate recording was higher in the neurological subgroup than the controls (one-way ANOVA, with the corrected p-value of the corresponding pairwise comparison). (G) Twenty-four-hour mean heart rate was higher in the Wilson's disease patients than the controls (independent t-test). (H) Twenty-four-hour mean heart rate of the two subgroups of Wilson's disease patients and the controls. HR, heart rate; Neuro, the subgroup with initial neurological presentation; Non-Neuro, the subgroup not with initial neurological presentation; t1, at baseline; t2, after 3-year follow-up; WD, Wilson's disease. Data are presented as mean with standard deviation.
