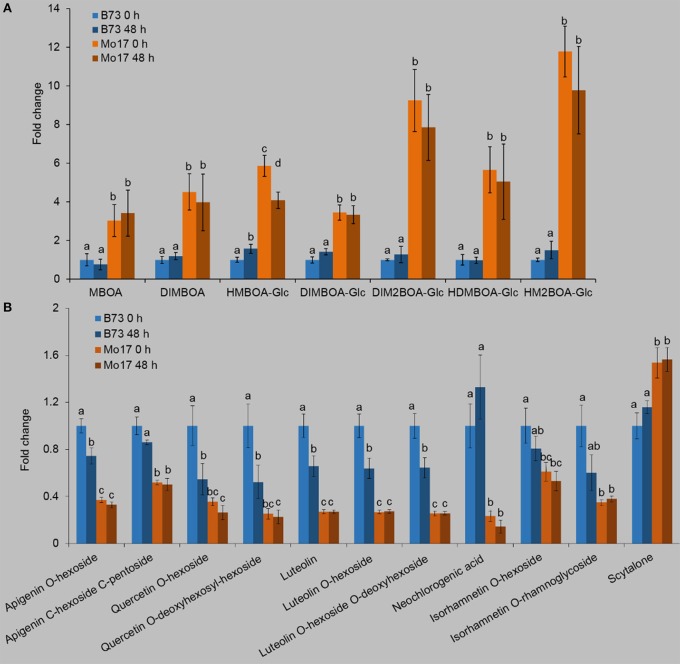
Figure 2.
Profiles of Bxs and phenolics in B73 and Mo17. Maize leaves were treated with R. padi herbivory, and samples were collected at 48 h; non-treated leaves severed as controls (0 h). Relative contents of Bxs (A) and phenolics (B) in B73 and Mo17. Values = means ± SE; n = 5; different letters above bars indicate significant differences (one-way ANOVA and Duncan's multiple range test; P < 0.05); all values of the B73 group are normalized to 1. Complete data can be found in Table S1.

