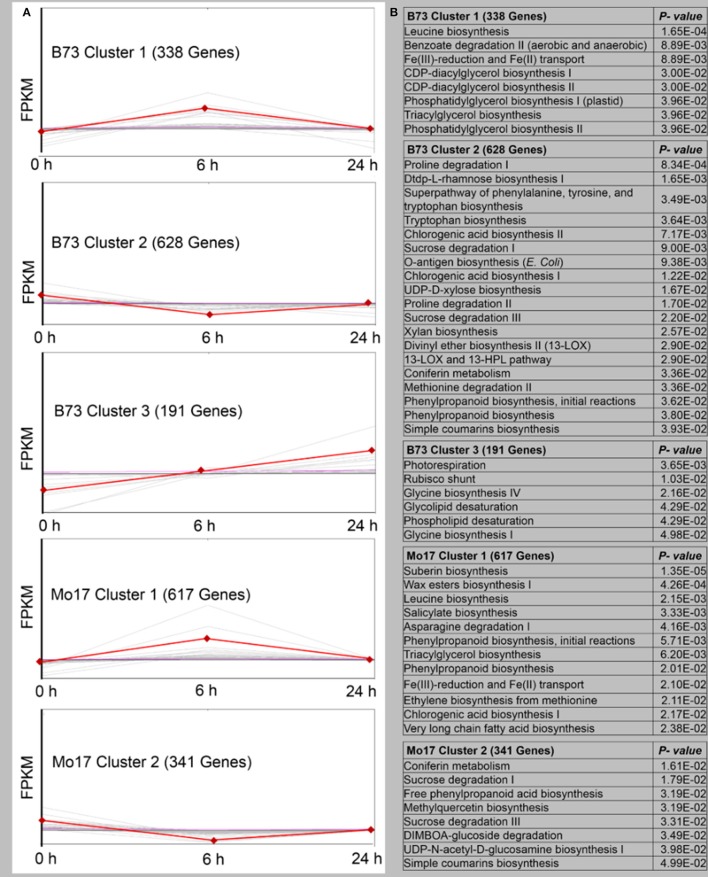
Figure 4.
Overview of gene expression trends and clusters in R. padi-treated B73 and Mo17. (A) A total of 1157 transcripts in B73 (in three clusters) and 958 transcripts in Mo17 (in two clusters) with significant expression profile changes for at least one time-point after the R. padi feeding. The total number of transcripts in each cluster is indicated in the brackets, and the data for individual genes are shown in light gray. Average expression values for each cluster are shown in red. All genes selected for this analysis have significant differences of 1-fold (up- or down-regulated), P < 0.05. (B) Pathway enrichment analysis of each cluster using MetGenMAP to identify metabolic functions that were regulated. Full descriptions can be found in Table S4.

